Easy Distributed Tracing with Spring Cloud Sleuth
Spring Cloud Sleuth allows you to aggregate and track log entries as requests move through a distributed software system. In a monolithic system, it’s relatively easy to track requests as they move through the codebase because all requests can easily be logged to the same log file. You can generally just filter the log by the thread ID. But in a distributed system, a single client request may sprawl across any number of discrete cloud services. Any given service may have multiple instances handling different parts of the request. There is no single log file, with a request spread across multiple server instances. How do you use logs in this situation? How do you trace a request flow across a service mesh?
In this tutorial, you will see how Spring Cloud Sleuth can be integrated into a Spring Boot application. The Spring Boot application will be secured using Okta as an OAuth 2.0 & OIDC provider. You’ll use the Okta CLI to configure Okta and Spring Boot. You’ll also download and run a Zipkin server to collect the Spring Cloud Sleuth entires and visualize them.
Table of Contents
- What is Spring Cloud Sleuth?
- Bootstrap a Spring Boot App Using the Spring Initializr
- Configure Spring Boot for OIDC Authentication
- Create a Security Configuration Class
- Make an Example Spring Cloud Sleuth App
- Launch a Zipkin Server
- Launch Two App Instances
- Create a Valid JWT with OIDC Debugger
- Confirm Spring Cloud Sleuth Works
- Learn More About Spring and Spring Boot
Note: In May 2025, the Okta Integrator Free Plan replaced Okta Developer Edition Accounts, and the Okta CLI was deprecated.
We preserved this post for reference, but the instructions no longer work exactly as written. Replace the Okta CLI commands by manually configuring Okta following the instructions in our Developer Documentation.
What is Spring Cloud Sleuth?
Spring Cloud Sleuth’s solution is to inject span and trace IDs into log entries. A trace ID is the unique identifier that an entire request flow will share. It’s like the glue that sticks all of the log entries together. A span is more local and is defined for each request received for each request sent event. They define particular interaction points. Spans can also be created for separate, discrete units of work within a process. These are called custom spans. Think of a span as a discrete chunk of processing or communication to be tracked.
The initial span, or root span, is generated when a client request is received from outside the distributed system. This request lacks trace and span information. The root span becomes the trace ID for the rest of the request flow through the system.
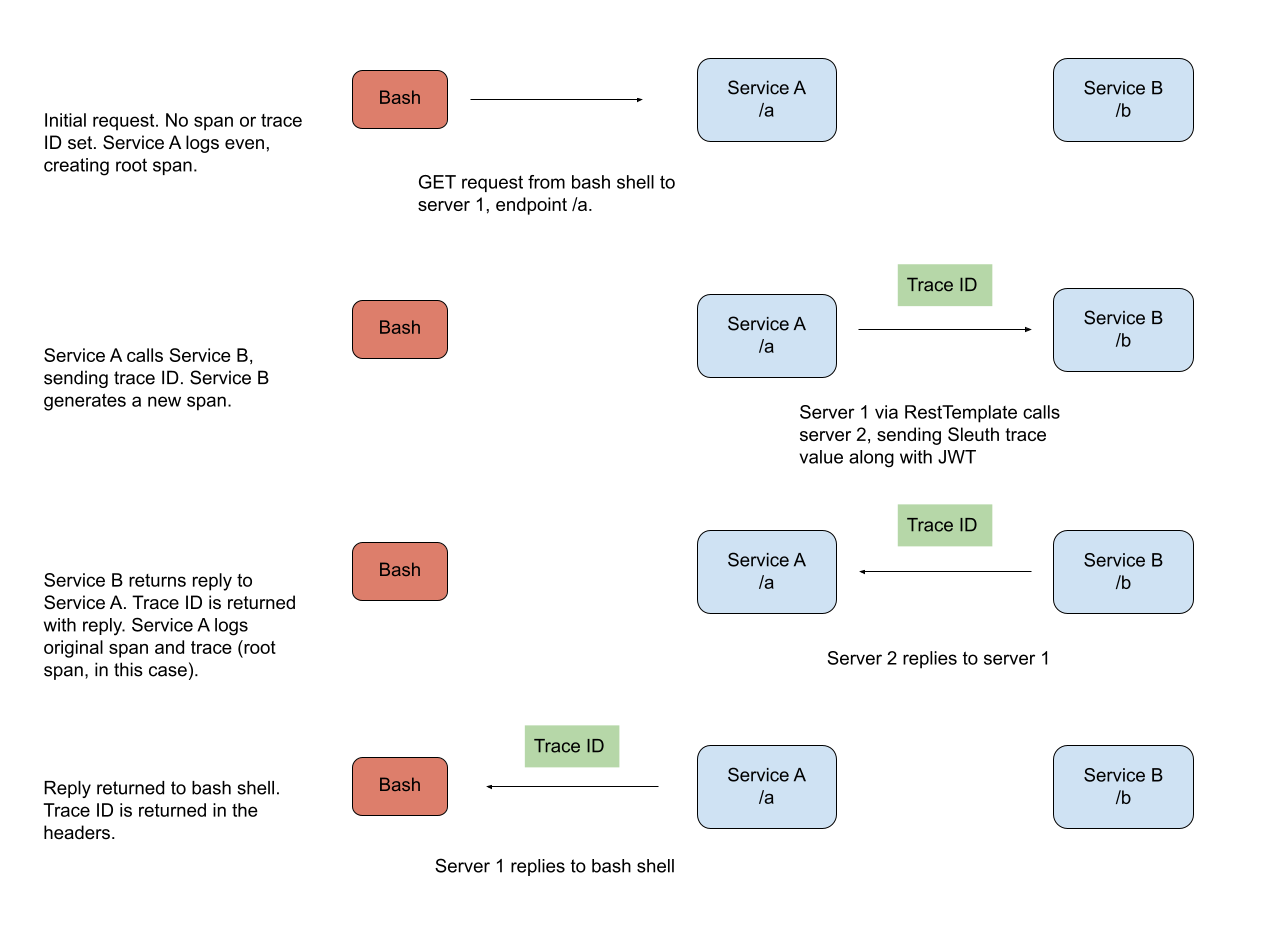
The diagram below shows how Sleuth span and trace generation would work through a hypothetical service network.
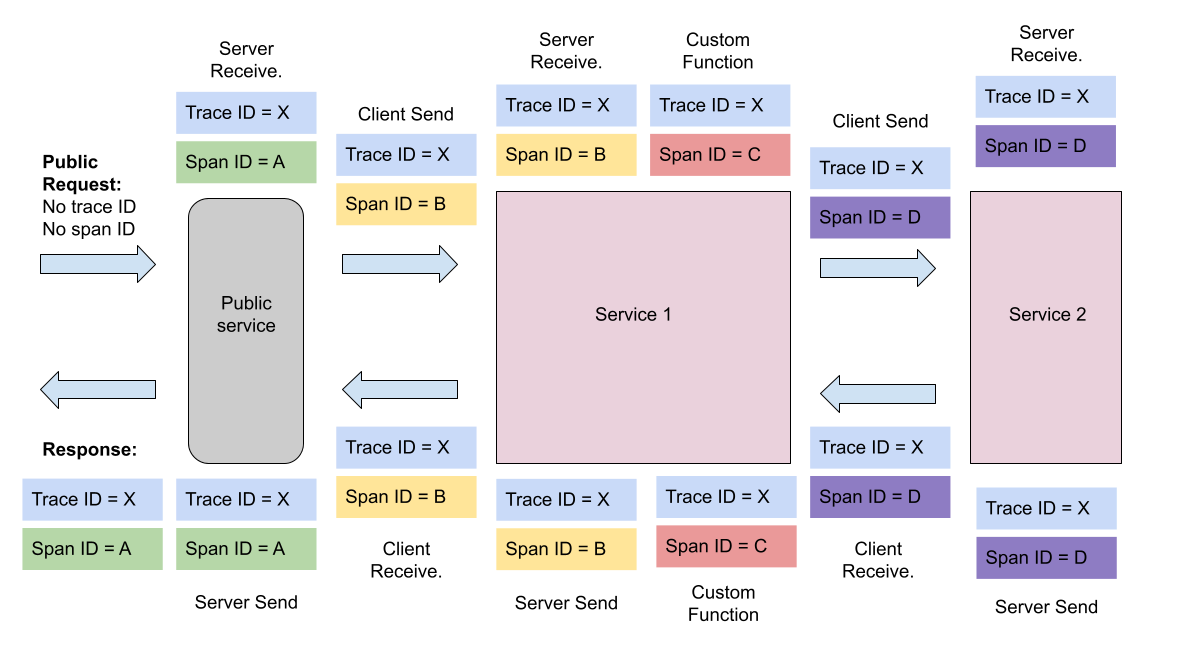
Notice how in the diagram above, the trace is the same throughout the entire processing flow. A trace will tie a tree of branching processing functions and server requests into a single, trackable unit. Also notice how each request to a new service automatically starts a new span. However, there is also a custom function. In this case, the process has started a side-process and has manually created and terminated a span.
You can read more about how spans and traces work in Slueth by looking at Spring’s documentation on the subject.
In practice, the span and trace IDs look like the following in log entries (the bracketed section after the INFO). Notice how the span ID and trace ID are the same? That’s because this is the root span, the beginning of the request tree identified by that particular trace ID.
service1.log:2016-02-26 11:15:47.561 INFO [service1,2485ec27856c56f4,2485ec27856c56f4] 68058 --- [nio-8081-exec-1] i.s.c.sleuth.docs.service1.Application : Hello from service1. Calling service2
These are the Sleuth span and trace IDs associated with the service name.
[service1,2485ec27856c56f4,2485ec27856c56f4]
[SERVICE NAME,TRACE,SPAN]
Once you have all these nifty log entries with IDs in them, you need a log aggregation and analytics tool to make sense of them. You can use any of the freely available tools: Kibana, Splunk, Logstash, etc. if you want. In this tutorial, you’ll use Zipkin. Zipkin is a Java-based distributed tracing system designed for this use case and seamlessly works with Spring Cloud Sleuth.
In this tutorial, you will create a simple, example Spring Boot service with two endpoints. You’re going to run two different instances of this service and use HTTPie to make a request to one instance of the service. This service will make a request to the second instance of the service, which will return a reply to the first service, which will return a reply to your original request. This request process will be logged, and the Sleuth log entries automatically pushed to a local Zipkin server, and you will be able to visualize the request flow using the Zipkin server.
The point of the example is to demonstrate how to integrate Spring Cloud Sleuth and how Spring Cloud Sleuth allows you to track request flow across different services, also, how the whole process can be secured using Okta and JSON Web Tokens.
Before you get started, you need to have a few things installed.
- Java 11: This project uses Java 11. OpenJDK 11 will work just as well. Instructions are found on the OpenJDK website. OpenJDK can also be installed using Homebrew. Alternatively, SDKMAN is another excellent option for installing and managing Java versions.
- Okta CLI: You’ll be using Okta as an OAuth/OIDC provider to add JWT authentication and authorization to the application. You can go to our developer site to learn more about Okta. You need a free developer account for this tutorial. The Okta CLI is an easy way to register for a free Okta developer account or log in to an existing one and configure a Spring Boot app to use Okta as an auth provider. The project GitHub page has installation instructions.
- HTTPie: This is a powerful command-line HTTP request utility that you’ll use to test the Spring Boot server. Install it according to the docs on their site.
Bootstrap a Spring Boot App Using the Spring Initializr
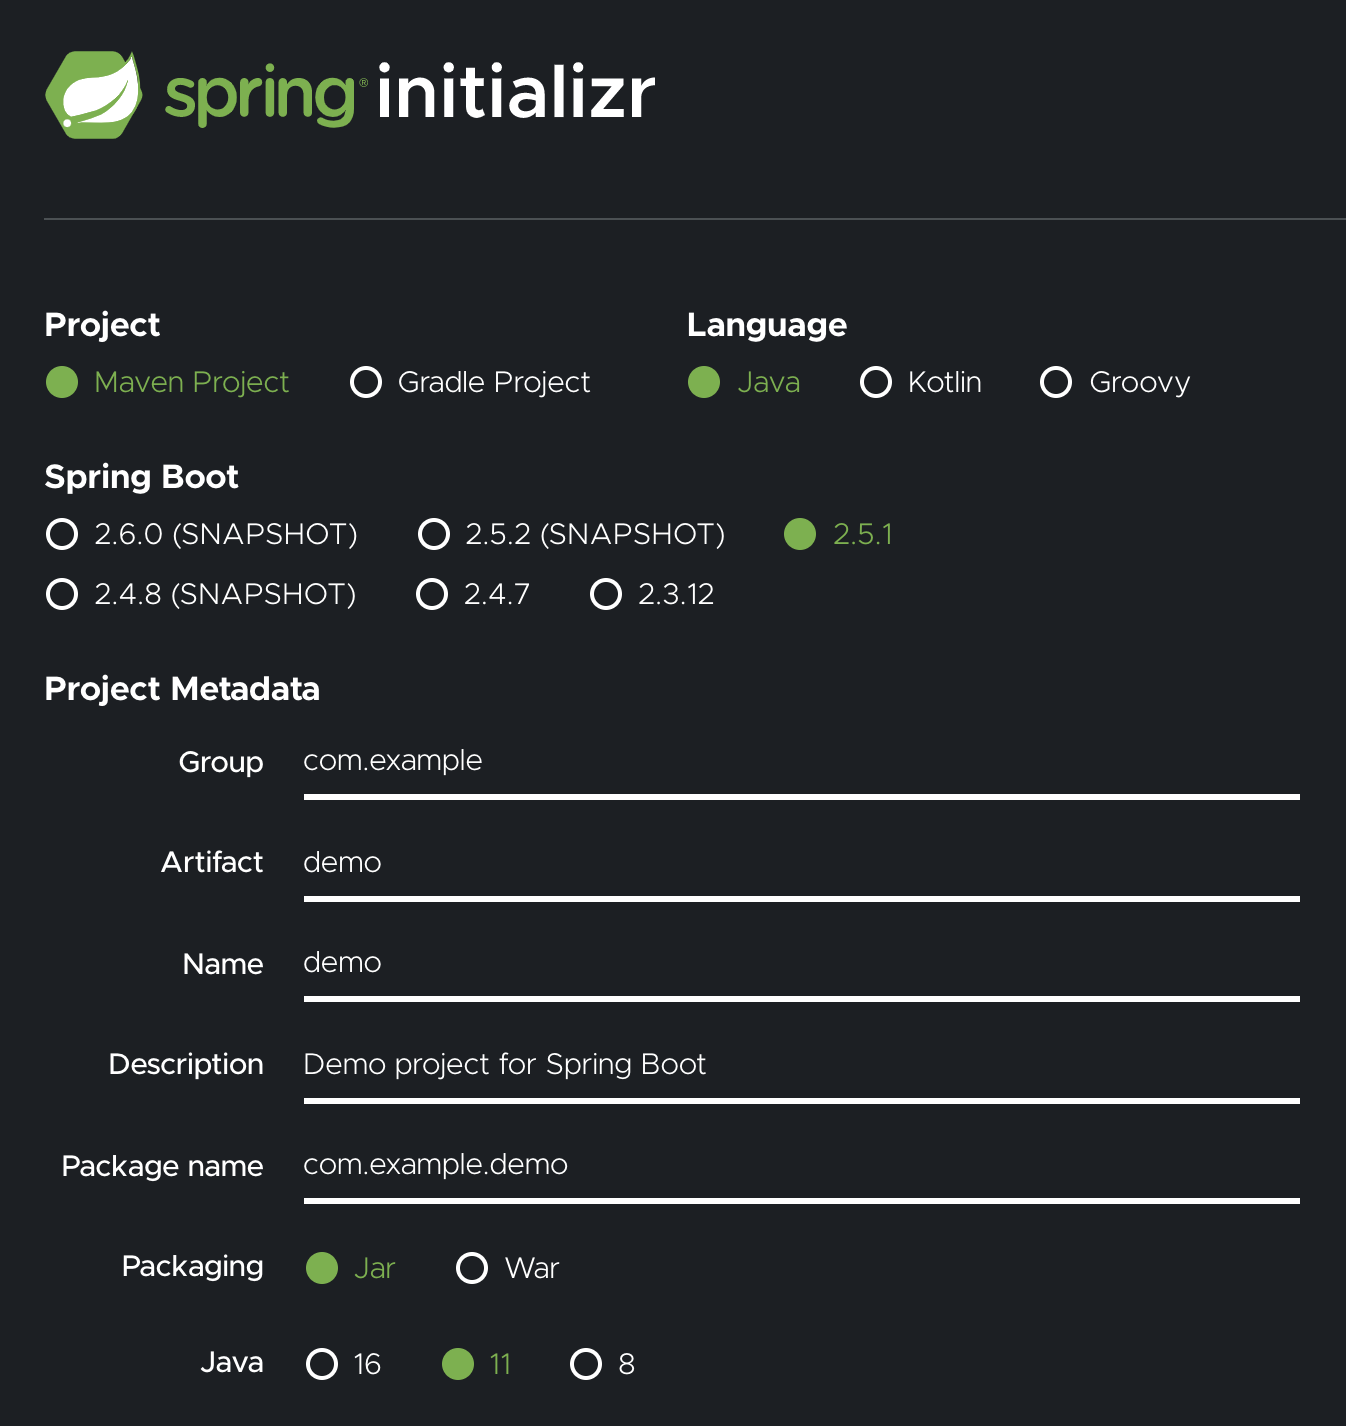
Spring has a great project called Spring Initializr. Why no “e”? Because it’s cool, that’s why. Joking aside, it’s pretty great. You can go to start.spring.io and quickly configure a starter project. You can browse the project online before you download it. You can get a link you can share and save for the configured project. And you can even use a REST API, which is what you’ll do below.
Open a bash shell and run the command below. This will download the project as a compressed tarball, untar it, and navigate you into the project directory.
curl https://start.spring.io/starter.tgz \
 -d dependencies=web,cloud-starter-sleuth,okta,cloud-starter-zipkin \
 -d baseDir=spring-cloud-sleuth-demo | tar -xzvf -
cd spring-cloud-sleuth-demo
The command uses a lot of the default settings. It uses Maven as the dependency manager. It uses Java as the programming language. It uses Spring Boot 2.4.5 (the current release at the time of writing this tutorial). It creates a JAR as the build target. Finally, it specifies Java 11 (again, at the time of this tutorial).
The most important thing it configures is four dependencies.
- Spring Web - adds Spring MVC for building RESTful web applications using Tomcat as the default server
- Spring Cloud Sleuth - adds the basic dependencies to write Sleuth-compatible log entries
- Zipkin Client - adds the ability to write Sleuth entries to a Zipkin client
- Okta Spring Boot Starter - adds Okta’s Spring Boot Starter, which helps configure Spring Boot for use with Okta as an OIDC and OAuth 2.0 provider
The demo application can be run with ./mvnw spring-boot:run. However, it has no endpoints defined and doesn’t do anything except start. So, before you make it do something more exciting, first you need to configure Okta and JWT auth.
Configure Spring Boot for OIDC Authentication
OIDC is an authentication protocol that, along with OAuth 2.0, provides a spec for a complete authentication and authorization protocol. This is the protocol that Okta and Spring implement to provide the secure, standards-compliant JSON web token (JWT) authentication solution that you’ll use in this tutorial. Creating an OIDC application on Okta configures Okta as an authentication provider for your Spring Boot application.
Open a bash shell and navigate to the demo project root directory.
Before you begin, you’ll need a free Okta developer account. Install the Okta CLI and run okta register to sign up for a new account. If you already have an account, run okta login.
Then, run okta apps create. Select the default app name, or change it as you see fit.
Choose Web and press Enter.
Select Okta Spring Boot Starter.
Accept the default Redirect URI values provided for you. That is, a Login Redirect of http://localhost:8080/login/oauth2/code/okta and a Logout Redirect of http://localhost:8080.
What does the Okta CLI do?
The Okta CLI will create an OIDC Web App in your Okta Org. It will add the redirect URIs you specified and grant access to the Everyone group. You will see output like the following when it’s finished:
Okta application configuration has been written to:
  /path/to/app/src/main/resources/application.properties
Open src/main/resources/application.properties to see the issuer and credentials for your app.
okta.oauth2.issuer=https://dev-133337.okta.com/oauth2/default
okta.oauth2.client-id=0oab8eb55Kb9jdMIr5d6
okta.oauth2.client-secret=NEVER-SHOW-SECRETS
NOTE: You can also use the Okta Admin Console to create your app. See Create a Spring Boot App for more information.
Open your src/main/resources/application.properties file. You should see something like the following.
okta.oauth2.issuer=https\://dev-123456.okta.com/oauth2/default
okta.oauth2.client-secret={yourClientSecret}
okta.oauth2.client-id={yourClientId}
While you’ve got the properties file open, add a couple of new properties.
spring.application.name=${APP_NAME}
server.port=${APP_PORT}
These two properties will allow you to specify the application name and port from the command line when your boot the app. You need to be able to do this because you’ll need to run two distinct application instances with different names on different local ports.
Create a Security Configuration Class
To configure the Spring Boot application as a resource server, create a SecurityConfiguration class. The following class tells Spring Boot to authenticate all requests and use JWT-based auth for the resource server.
src/main/java/com/example/demo/SecurityConfiguration.java
@EnableWebSecurity
public class SecurityConfiguration extends WebSecurityConfigurerAdapter {

    @Override
    protected void configure(HttpSecurity http) throws Exception {
        http
            .authorizeRequests(authorizeRequests ->
                authorizeRequests.anyRequest().authenticated())
            .oauth2ResourceServer().jwt();
    }

}
Make an Example Spring Cloud Sleuth App
Replace the DemoApplication class with the code listed below. I’ll explain the code below.
src/main/java/com/example/demo/DemoApplication.java
package com.example.demo;

import org.slf4j.Logger;
import org.slf4j.LoggerFactory;
import org.springframework.beans.factory.annotation.Value;
import org.springframework.boot.SpringApplication;
import org.springframework.boot.autoconfigure.SpringBootApplication;
import org.springframework.boot.web.client.RestTemplateBuilder;
import org.springframework.context.annotation.Bean;
import org.springframework.http.HttpEntity;
import org.springframework.http.HttpHeaders;
import org.springframework.http.HttpMethod;
import org.springframework.http.ResponseEntity;
import org.springframework.web.bind.annotation.GetMapping;
import org.springframework.web.bind.annotation.RequestHeader;
import org.springframework.web.bind.annotation.RestController;
import org.springframework.web.client.RestTemplate;

@SpringBootApplication
public class DemoApplication {

    public static void main(String[] args) {
        SpringApplication.run(DemoApplication.class, args);
    }

    @Bean
    RestTemplate myRestTemplate() {
        return new RestTemplate();
    }

    @RestController
    static class SimpleRestController {

        private static Logger log = LoggerFactory.getLogger(SimpleRestController.class);
        private final RestTemplate restTemplate;

        SimpleRestController(RestTemplateBuilder restTemplateBuilder) {
            this.restTemplate = restTemplateBuilder.build();
        }

        @Value("${APP_NAME}")
        private String appName;

        @GetMapping("/a")
        String a(@RequestHeader(name = "Authorization") String authToken) {

            log.info("Handling a - " + appName);

            HttpHeaders headers = new HttpHeaders();
            headers.add("Authorization", authToken);
            HttpEntity request = new HttpEntity(headers);

            ResponseEntity<String> response = restTemplate.exchange(
                "http://localhost:8082/b",
                HttpMethod.GET,
                request,
                String.class
            );

            String result = response.getBody();
            log.info("Reply = " + result);

            return "Hello from /a - " + appName + ", " + result;
        }

        @GetMapping("/b")
        String b(@RequestHeader(name = "Authorization") String authToken) {
            log.info("Handling b - " + appName);
            return "Hello from /b - " + appName;
        }
    }
}
The demo app creates two endpoints, cunningly named a and b. To demonstrate how Sleuth works across services in a network of microservices, you will run two instances of this application. Using HTTPie, you’ll call endpoint a, which will call endpoint b. Endpoint b will return a result to endpoint a, which will return a combined result to your shell.
The logging statements are important. This is where the Sleuth span and trace markers are going to get injected into your logs and sent to the Zipkin server (which you’ll set up in a moment).
In endpoint a, notice that the code grabs the JWT token from the header as a request param and uses Spring’s RestTemplate to make a request to endpoint b including the token in the request. Both endpoints will require this token for authentication, so this is important. It’s also important that you use Spring’s RestTemplate and that you inject it as a bean because this allows Spring Cloud Sleuth to automatically include the Sleuth trace ID in the request, which is the main point here, tracking request flow across different services.
If you don’t inject the RestTemplate as a bean but instead instantiate it directly in the method or use a different HTTP client, you will need to manually add the Sleuth trace ID.
Launch a Zipkin Server
Before you start the two instances of the Spring Boot app, you need to launch your Zipkin server. Because the project includes the Zipkin Client dependency (along with the Spring Cloud Sleuth dependency), Spring Boot is configured to send logging information to a Zipkin server at the default port :9441. This includes a graphical interface that allows you to search and view log traces.
For more information on the Zipkin server, take a look at their quick start page. The Zipkin server you’re launching uses a default, in-memory store that does not persist data. When you restart the service, all data will be lost. This is great for testing. For production, you might want to use a persisting store. Zipkin supports Cassandra, Elasticsearch, and MySQL. See the GitHub page for more information.
There is a Spring Boot annotation, @EnableZipkinServer, that launches a Zipkin server for you. However, this annotation is deprecated. Instead, they suggest downloading the server as a JAR file and launching that.
Open a new bash shell. Use the following command to download the latest Zipkin server as a JAR file.
curl -sSL https://zipkin.io/quickstart.sh | bash -s io.zipkin:zipkin-server:LATEST:slim zipkin.jar
Run the server and leave it running while you’re working on the tutorial.
java -jar zipkin.jar
You’ll see some output on the console ending with the following.
2021-06-21 10:19:20:587 [armeria-boss-http-*:9411] INFO Server - Serving HTTP at /0:0:0:0:0:0:0:0%0:9411 - http://127.0.0.1:9411/
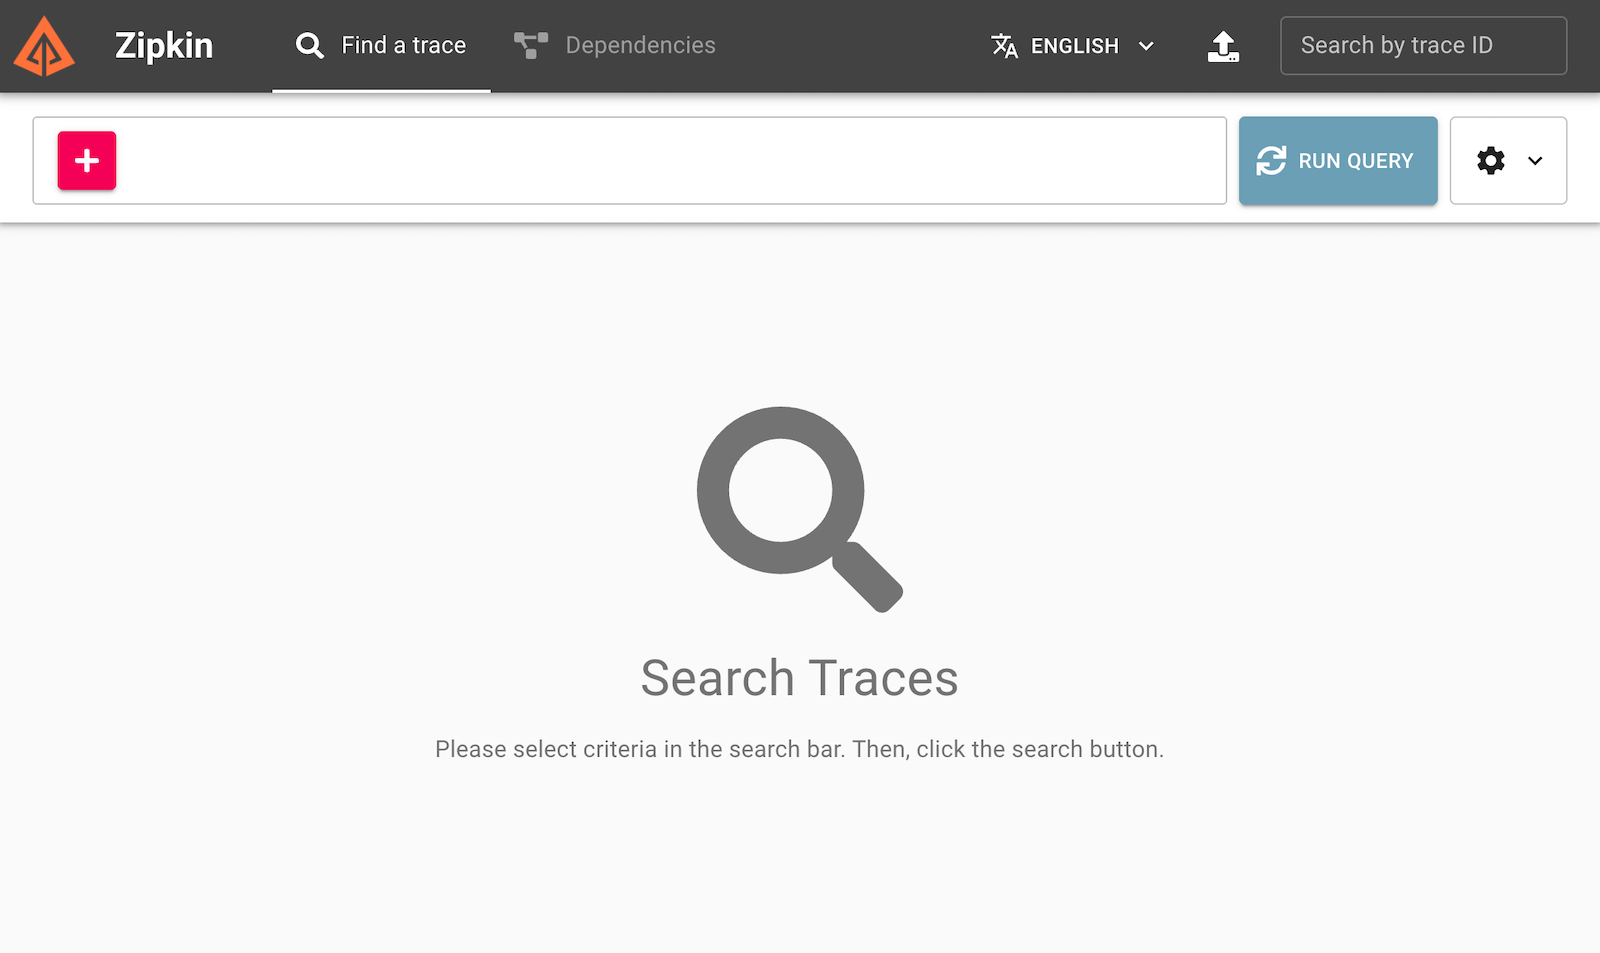
There’s nothing to see yet, but you can open the Zipkin dashboard in a browser: http://localhost:9411.
Launch Two App Instances
Now you’re ready to launch the instances of your app. First, you need to run the following commands in two separate shells. Notice that you’re using the environment variables to pass the application name and port to the Spring Boot app.
Service A:
APP_NAME="Service A" APP_PORT=8081 ./mvnw spring-boot:run
Service B:
APP_NAME="Service B" APP_PORT=8082 ./mvnw spring-boot:run
You should see console output like the following for both apps.
...
2021-06-21 10:26:41.539  INFO [Service A,,] 126840 --- [           main] o.s.s.concurrent.ThreadPoolTaskExecutor  : Initializing ExecutorService 'applicationTaskExecutor'
2021-06-21 10:26:41.769  INFO [Service A,,] 126840 --- [           main] o.s.b.w.embedded.tomcat.TomcatWebServer  : Tomcat started on port(s): 8081 (http) with context path ''
2021-06-21 10:26:41.792  INFO [Service A,,] 126840 --- [           main] com.example.demo.DemoApplication         : Started DemoApplication in 2.781 seconds (JVM running for 2.975)
Try a test request. Open a new bash shell (the fourth, for those counting). Use HTTPie to make a GET request at the /a endpoint.
http :8081/a
You’ll get denied.
HTTP/1.1 401
This is expected. You need to include a valid JWT.
Create a Valid JWT with OIDC Debugger
An easy way to get an access token is to generate one using OpenID Connect Debugger. Open the site in a new window or tab. Fill in your client ID, and use https://{yourOktaDomain}/oauth2/default/v1/authorize for the Authorize URI. Select code for the response type and Use PKCE.
Scroll down and click SEND REQUEST.
You should get a success page with an access token. Then, if you’re curious, you can inspect the decoded token.
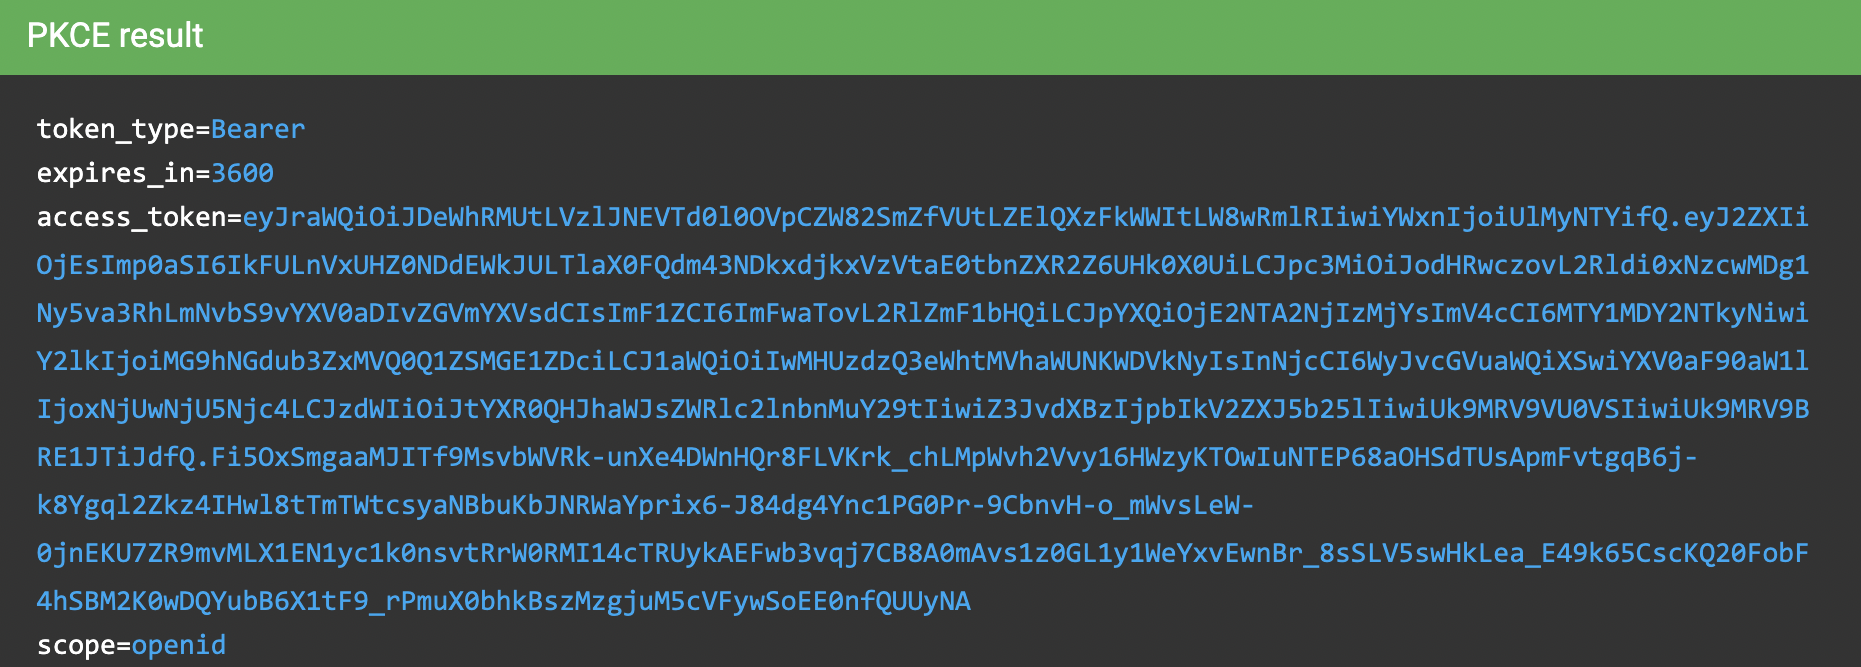
Copy the access token’s value to the clipboard.
In the bash shell that you will make the HTTP requests from, save the token value as a shell variable.
TOKEN=eyJraWQiOiJJdXVaRG00RTg5WUg5U1JoeC1tbWl...
Confirm Spring Cloud Sleuth Works
Great. At this point, you should have four bash terminals going.
- Spring Boot service A
- Spring Boot service B
- Zipkin server
- Bash terminal for making requests with HTTPie (where you just stored your JWT)
You’re going to make a simple GET request to service A on endpoint /a. Service A will log the request and make a call to service B on endpoint /b. Service B will log that request and return a reply back to service A. Service A will log that it received a reply and will return the reply to your bash terminal.
This example is a little contrived, but the point is to show you how each log event will have a unique Sleuth span value while the entire request flow will share the same trace value.
Make a request to service A endpoint /a using the JWT you just created.
http :8081/a "Authorization: Bearer $TOKEN"
If all went well, you should see this.
HTTP/1.1 200
...

Hello from /a - Service A, Hello from /b - Service B
Take a look at the console output from the two services.
Service A
2021-06-21 15:28:38.800  INFO [Service A,ef0fe81ff18325ff,ef0fe81ff18325ff] 14429 --- [nio-8081-exec-1] e.d.DemoApplication$SimpleRestController : Handling a - Service A
2021-06-21 15:28:39.577  INFO [Service A,ef0fe81ff18325ff,ef0fe81ff18325ff] 14429 --- [nio-8081-exec-1] e.d.DemoApplication$SimpleRestController : Reply = Hello from /b - Service B
Service B
2021-06-21 15:28:39.556 INFO [Service B,ef0fe81ff18325ff,76b95441dd8d0300] 14466 --- [nio-8082-exec-1] e.d.DemoApplication$SimpleRestController : Handling b - Service B
All of these log entries have the Sleuth span and trace IDs injected into them, along with the service names.
[Service A,ef0fe81ff18325ff,ef0fe81ff18325ff]
[SERVICE NAME, TRACE, SPAN]
Notice how the first ID is the same for all three entries. That’s the Sleuth trace ID that ties the entire request sequence together. Also, notice that for the entries for service A, the span and trace IDs are actually the same. That’s because this is the initial Sleuth logging event that kicks off the request tree, so that ID is the ID of the root span, which becomes the trace ID for the rest of the tree.
Take a look at the Zipkin dashboard at http://localhost:9411.
Click Run Query. You’ll have one result.
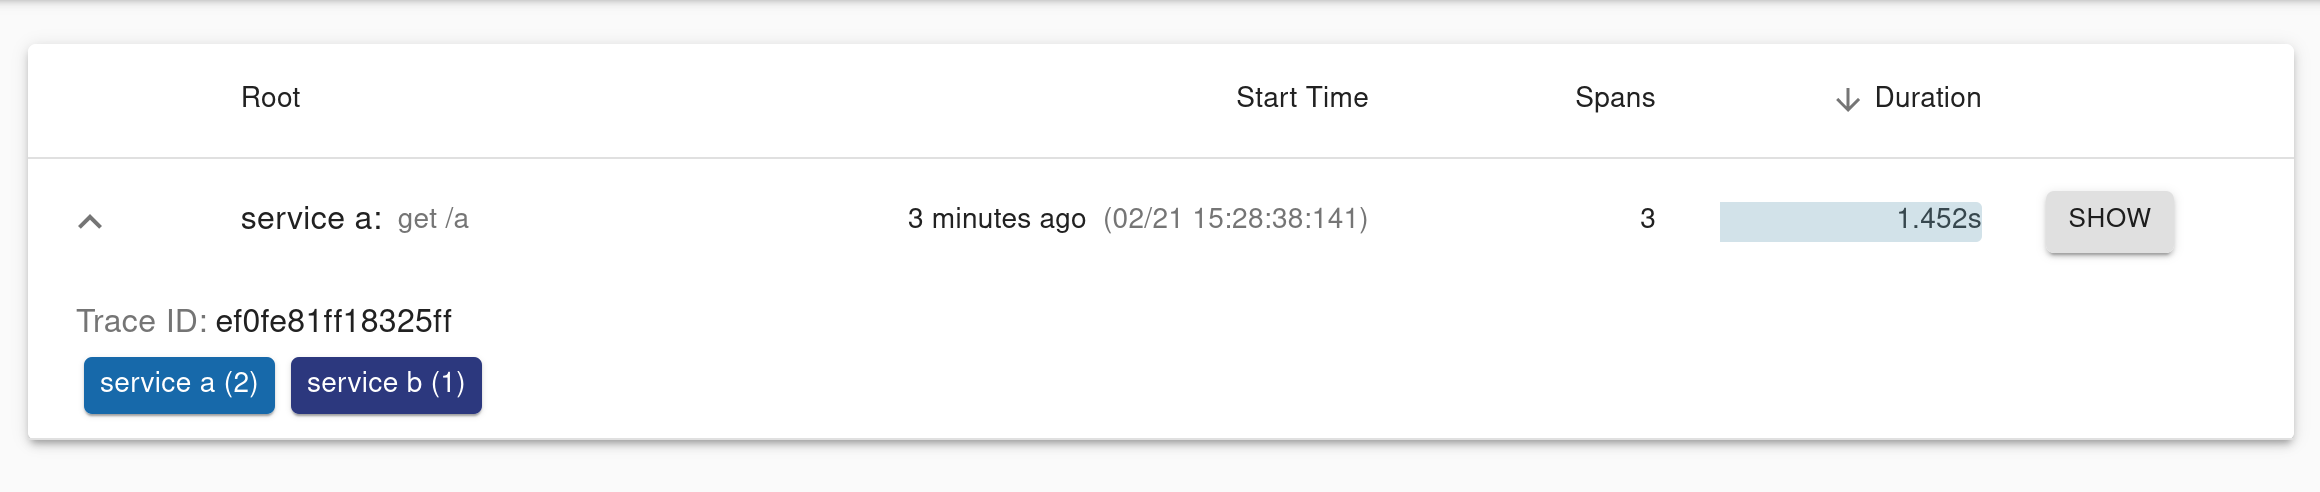
Click on Show, and you’ll see a detailed summary of the request tracing and logging.
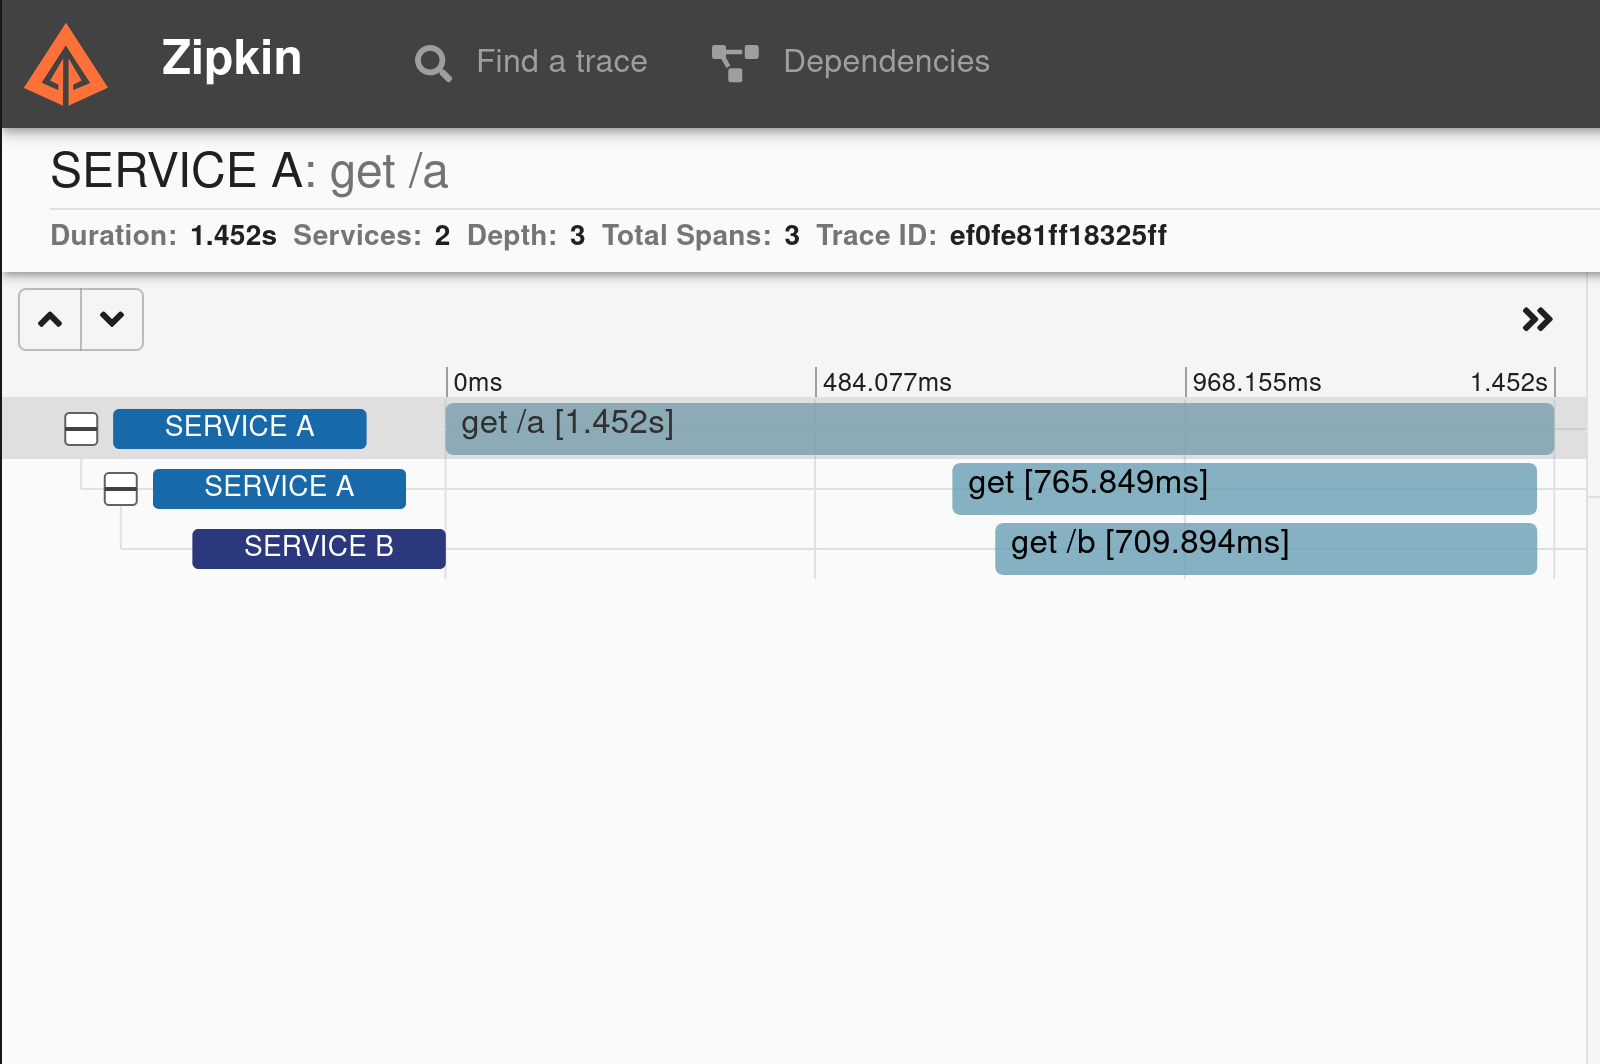
If you look at the detailed graph, you’ll see three spans. The original GET request from the bash shell is the first one. Within that, a span encompasses the GET request to service B from service A and a third span encompasses service B receiving the GET request.
Learn More About Spring and Spring Boot
In this tutorial, you learned a little about Spring Cloud Sleuth and how it can trace requests through service meshes built with Spring Boot. You created an example application that you started two instances of and used Spring Cloud Sleuth to track an example request through the service network. Next, you secured the services using Okta JWT OAuth 2.0 and OIDC. Finally, you ran a local Zipkin server that allowed you to visualize the Sleuth span and trace entries in your logs.
You can find the source code for this example on GitHub in the okta-spring-cloud-sleuth-example repository.
We have a slew of other posts on Spring Boot you might like:
- Build Native Java Apps with Micronaut, Quarkus, and Spring Boot
- R2DBC and Spring for Non-Blocking Database Access
- How to Use Client Credentials Flow with Spring Security
- Kubernetes to the Cloud with Spring Boot and JHipster
If you have any questions about this post, please add a comment below. For more awesome content, follow @oktadev on Twitter, like us on Facebook, or subscribe to our YouTube channel.
Changelog:
- Sep 17, 2021: Based on feedback in comments, fixed a typo, updated the sleuth-example-diagram.png file, and more clearly explained about custom spans. See the updates in okta-blog#889.
Okta Developer Blog Comment Policy
We welcome relevant and respectful comments. Off-topic comments may be removed.