Get Started with the ELK Stack

Good design principles require that microservices architectures are observable, and provide a centralized monitoring tool. This tool allows development teams to verify the overall system health, inspect logs and errors, and get feedback after deployments. So what is the Elastic (or ELK) Stack and why it is an excellent option to meet this need?
In this tutorial post, you will learn how to …
- Set up and run the ELK stack in Docker containers
- Set up JHipster Console to monitor microservices infrastructure
- Create a microservices architecture with JHipster
- Enable monitoring with JHipster Console
- Configure OpenID Connect authentication for microservices
Table of Contents
- The Evolution of the Elastic Stack
- Set up the Elastic Stack
- The JHipster Console
- Create a Java Microservices Architecture with JHipster
- Learn More About JHipster and Elastic Stack
Note: In May 2025, the Okta Integrator Free Plan replaced Okta Developer Edition Accounts, and the Okta CLI was deprecated.
We preserved this post for reference, but the instructions no longer work exactly as written. Replace the Okta CLI commands by manually configuring Okta following the instructions in our Developer Documentation.
The Evolution of the Elastic Stack
The acronym ELK stands for Elasticsearch, Logstash, and Kibana, three open-source projects that form a powerful stack for log ingestion and visualization, log search, event analysis, and helpful visual metrics for monitoring applications.
Elasticsearch is the heart of the stack: a JSON-based search and analytics engine, distributed and scalable. It was built on top of Apache Lucene and provides a JSON REST API, cluster management, high availability, and fault tolerance.
Logstash is an ETL (extract, transform, load) tool to enrich documents, run data processing pipelines. These pipelines ingest data from multiple sources, transform and send it to Elasticsearch.
Kibana provides the visualization front-end, a window into the Elastic Stack. With dashboards and visualization elements, the data stored in Elasticsearch can be explored, aggregated and analyzed.
From version 7 on, the ELK Stack was renamed to Elastic Stack and added Beats to the stack. Beats is a family of lightweight data shippers that work with Elasticsearch and Logstash.
Set up the Elastic Stack
Elastic has published a Docker Compose configuration, to demonstrate the stack components on a single machine. Install Docker and Docker Compose and follow these steps to start up the stack:
Windows users must configure 2 environment variables, check out the instructions on the stack-docker github repository
Allow at least 4GB of RAM for the containers, also check out instructions for your environment
-
Clone the
stack-dockerrepositorygit clone https://github.com/elastic/stack-docker.git -
Setup the stack with Docker Compose
 cd stack-docker
 docker-compose -f setup.yml up
When the setup completes, it will output the password for the elastic user. On a slow connection, this can take up to 20 minutes. When it completes, you will see the following logs:
setup_1 | Setup completed successfully. To start the stack please run: setup_1 | docker-compose up -d setup_1 | setup_1 | If you wish to remove the setup containers please run: setup_1 | docker-compose -f docker-compose.yml -f docker-compose.setup.yml down --remove-orphans setup_1 | setup_1 | You will have to re-start the stack after removing setup containers. setup_1 | setup_1 | Your 'elastic' user password is: Z8GFVXu9UVsBrM6nup5fHw== stack-docker_setup_1 exited with code 0 -
Launch the stack
Start the stack in the foreground to watch the containers logs:
docker-compose upWhen you see Kibana log the response to health check requests sent by the Beats family and you see at least one heartbeat entry in the logs, you can try the login (step 4 below):
 kibana           | {"type":"response","@timestamp":"2019-09-23T20:38:47Z","tags":[],"pid":1,"method":"get","statusCode":200,"req":{"url":"/login?next=%2F","method":"get","headers":{"host":"kibana:5601","user-agent":"Go-http-client/1.1","referer":"http://kibana:5601"},"remoteAddress":"172.25.0.9","userAgent":"172.25.0.9","referer":"http://kibana:5601"},"res":{"statusCode":200,"responseTime":30,"contentLength":9},"message":"GET /login?next=%2F 200 30ms - 9.0B"}
 ...
 heartbeat        | 2019-09-23T20:38:52.213Z	INFO	[monitoring]	log/log.go:144	Non-zero metrics in the last 30s	{"monitoring": {"metrics": {"beat":{"cpu":{"system":{"ticks":160,"time":{"ms":50}},"total":{"ticks":430,"time":{"ms":120},"value":430},"user":{"ticks":270,"time":{"ms":70}}},"handles":{"limit":{"hard":1048576,"soft":1048576},"open":9},"info":{"ephemeral_id":"d8d4f6a2-39fa-41cb-9e9c-520438d49a9e","uptime":{"ms":93132}},"memstats":{"gc_next":4194304,"memory_alloc":3365792,"memory_total":12191384,"rss":327680}},"libbeat":{"config":{"module":{"running":0}},"output":{"events":{"acked":24,"batches":6,"total":24},"read":{"bytes":5970},"write":{"bytes":16878}},"pipeline":{"clients":4,"events":{"active":0,"published":24,"total":24},"queue":{"acked":24}}},"system":{"load":{"1":4.83,"15":2.43,"5":3.44,"norm":{"1":1.2075,"15":0.6075,"5":0.86}}}}}}
You may notice exceptions in the log output. For this demonstration, they can be safely ignored. If you run into any issues with docker, you can start fresh with:
 docker container ls -a | cut -c1-12 | xargs docker container rm --force
 docker images | cut -c69-80 | xargs docker rmi
 docker system prune -a
NOTE: This will destroy all docker containers, images and networks, so use at your own risk.
-
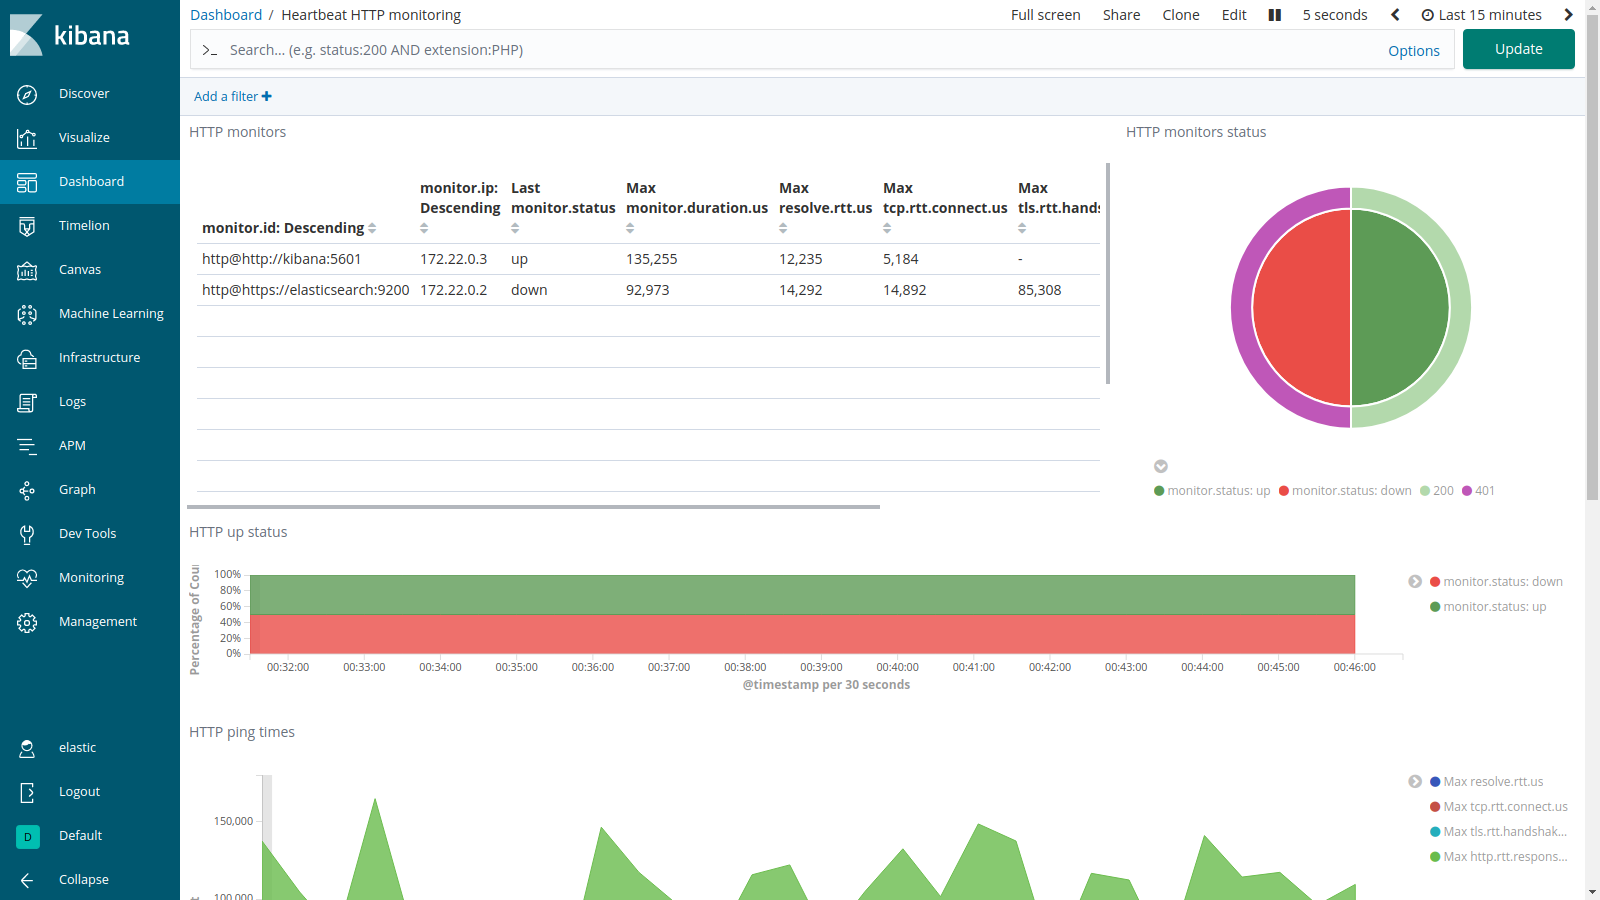
Go to http://localhost:5601 to log into Kibana.
Once you log in (using the elastic user and the password you captured above), explore the installed dashboards from the Dashboards section via the menu on the left. Heartbeat is one of the Beat services that monitors your services uptime from a provided list of URLs. Open the dashboard Heartbeat HTTP monitoring and see the power of the stack for data visualization.
The JHipster Console
The Jhipster Console, an awesome monitoring solution based on the Elastic Stack, allows the visualization and analysis of JHipster applications metrics over time. The Console provides pre-configured dashboards to monitor microservices infrastructure. You can review the complete list of features in JHipster Console’s documentation.
One of the easier ways to start with the JHipster Console is to deploy the applications and enable monitoring with the docker-compose sub-generator. You’ll use this to:
- Create a microservices architecture with JHipster
- Enable monitoring with JHipster Console
- Configure OpenID Connect for authentication to microservices
Create a Java Microservices Architecture with JHipster
To install a version of JHipster that will work here, you need to install Node.js.
Install JHipster
npm install -g generator-jhipster@6.3.1
jhipster --version
The version command should output something like this:
INFO! Using JHipster version installed globally
6.3.1
Create a directory for the project:
mkdir jhipster
cd jhipster
Create apps.jh to define store, blog, and gateway microservices in JHipster Domain Language (JDL). We are going to recreate a Java-based example of microservices architecture we have built before for this tutorial.
application {
  config {
    baseName gateway,
    packageName com.okta.developer.gateway,
    applicationType gateway,
    authenticationType oauth2,
    prodDatabaseType postgresql,
    serviceDiscoveryType eureka,
    testFrameworks [protractor]
  }
  entities Blog, Post, Tag, Product
}

application {
  config {
    baseName blog,
    packageName com.okta.developer.blog,
    applicationType microservice,
    authenticationType oauth2,
    prodDatabaseType postgresql,
    serverPort 8081,
    serviceDiscoveryType eureka
  }
  entities Blog, Post, Tag
}

application {
  config {
    baseName store,
    packageName com.okta.developer.store,
    applicationType microservice,
    authenticationType oauth2,
    databaseType mongodb,
    devDatabaseType mongodb,
    prodDatabaseType mongodb,
    enableHibernateCache false,
    serverPort 8082,
    serviceDiscoveryType eureka
  }
  entities Product
}

entity Blog {
  name String required minlength(3),
  handle String required minlength(2)
}

entity Post {
  title String required,
  content TextBlob required,
  date Instant required
}

entity Tag {
  name String required minlength(2)
}

entity Product {
  title String required,
  price BigDecimal required min(0),
  image ImageBlob
}

relationship ManyToOne {
  Blog{user(login)} to User,
  Post{blog(name)} to Blog
}

relationship ManyToMany {
  Post{tag(name)} to Tag{post}
}

paginate Post, Tag with infinite-scroll
paginate Product with pagination

microservice Product with store
microservice Blog, Post, Tag with blog
Now, in your jhipster folder, run the import-jdl generator.
jhipster import-jdl apps.jh
Deploy Monitoring using docker-compose
In the project folder, create a subfolder for the docker-compose configuration and run the subgenerator.
mkdir docker-compose
cd docker-compose
jhipster docker-compose
The generator will ask you to define the following configurations:
- Type of application: Microservices application
- Type of gateway: JHipster based on Zuul
- Which applications to include: blog, gateway, store
- If the database is clustered: no
- if monitoring must be enabled: yes, with JHipster console
- Additional technologies for monitoring: Zipkin
- Password for JHipster Registry: default
You can see how this works in the recording below.
When the generator has almost finished, a warning shows in the output:
WARNING! Docker Compose configuration generated, but no Jib cache found
If you forgot to generate the Docker image for this application, please run:
To generate the missing Docker image(s), please run:
  ./mvnw package -Pprod verify jib:dockerBuild in /home/indiepopart/jhipster/blog
  ./mvnw package -Pprod verify jib:dockerBuild in /home/indiepopart/jhipster/gateway
  ./mvnw package -Pprod verify jib:dockerBuild in /home/indiepopart/jhipster/store
You can follow the instructions above for creating the microservices images, or create an aggregator pom.xml and use just one command for building all the images, as described in our post on Java microservices.
Setup Okta OpenID Connect (OIDC) Authentication for Your Microservices
By default, the microservices architecture authenticates against Keycloak. However, you can easily change it to use Okta.
Before you begin, you’ll need a free Okta developer account. Install the Okta CLI and run okta register to sign up for a new account. If you already have an account, run okta login.
Then, run okta apps create jhipster. Select the default app name, or change it as you see fit.
Accept the default Redirect URI values provided for you.
What does the Okta CLI do?
The Okta CLI streamlines configuring a JHipster app and does several things for you:
- Creates an OIDC app with the correct redirect URIs:
- login:
http://localhost:8080/login/oauth2/code/oidcandhttp://localhost:8761/login/oauth2/code/oidc - logout:
http://localhost:8080andhttp://localhost:8761
- login:
- Creates
ROLE_ADMINandROLE_USERgroups that JHipster expects - Adds your current user to the
ROLE_ADMINandROLE_USERgroups - Creates a
groupsclaim in your default authorization server and adds the user’s groups to it
NOTE: The http://localhost:8761* redirect URIs are for the JHipster Registry, which is often used when creating microservices with JHipster. The Okta CLI adds these by default.
You will see output like the following when it’s finished:
Okta application configuration has been written to: /path/to/app/.okta.env
Run cat .okta.env (or type .okta.env on Windows) to see the issuer and credentials for your app. It will look like this (except the placeholder values will be populated):
export SPRING_SECURITY_OAUTH2_CLIENT_PROVIDER_OIDC_ISSUER_URI="https://{yourOktaDomain}/oauth2/default"
export SPRING_SECURITY_OAUTH2_CLIENT_REGISTRATION_OIDC_CLIENT_ID="{clientId}"
export SPRING_SECURITY_OAUTH2_CLIENT_REGISTRATION_OIDC_CLIENT_SECRET="{clientSecret}"
NOTE: You can also use the Okta Admin Console to create your app. See Create a JHipster App on Okta for more information.
For simplicity, this tutorial only creates a Web App, and its credentials will be used for all the services. In a real environment, each service must identify itself with its own credentials, and you should create one Web App or Service for each one of them in the Okta console.
Create a docker-compose/.env file with the following content:
OIDC_CLIENT_ID=<client_id>
OIDC_CLIENT_SECRET=<client_secret>
RESOURCE_ISSUER_URI=<org_url>/oauth2/default
The values should come from the .okta.env file the Okta CLI created.
Edit docker-compose/docker-compose.yml and update the SECURITY_* settings for the services blog-app, gateway-app, and store-app:
SPRING_SECURITY_OAUTH2_CLIENT_PROVIDER_OIDC_ISSUER_URI=${RESOURCE_ISSUER_URI}
SPRING_SECURITY_OAUTH2_CLIENT_REGISTRATION_OIDC_CLIENT_ID=${OIDC_CLIENT_ID}
SPRING_SECURITY_OAUTH2_CLIENT_REGISTRATION_OIDC_CLIENT_SECRET=${OIDC_CLIENT_SECRET}
The same authentication must be set up for the JHipster Registry. Edit docker-compose/jhipster-registry.yml and set the same values as the environment section of the gateway-app.
Enable Debug Logs and Zipkin
To send debug logs to the JHipster Console, let’s update the log level in the prod profile. Edit src/main/resources/config/application-prod.yml to set the level for each service (blog-app, store-app, and gateway-app) to DEBUG for the com.okta.developer.* logger. For example, in the blog’s application-prod.yml:
logging:
    level:
        com.okta.developer.blog: DEBUG
Also, for each service, update the LoggingAspectConfiguration to load when the prod profile is active. Change the @Profile annotation:
@Configuration
@EnableAspectJAutoProxy
public class LoggingAspectConfiguration {

    @Bean
    @Profile({JHipsterConstants.SPRING_PROFILE_DEVELOPMENT, JHipsterConstants.SPRING_PROFILE_PRODUCTION})
    public LoggingAspect loggingAspect(Environment env) {
        return new LoggingAspect(env);
    }
}
Zipkin is a distributed tracing system that helps to troubleshoot latency issues in microservices architectures. With a traceId propagated from service to service, calls to different services can be correlated and analyzed as a part of the same flow. The Zipkin server and UI are provided with the JHipster Console, and JHipster apps can integrate with Zipkin through Spring Cloud Sleuth.
To enable Zipkin tracing, add the zipkin profile to blog-app, gateway-app, and store-app in docker-compose/docker-compose.yml.
- SPRING_PROFILES_ACTIVE=prod,swagger,zipkin
You also need to rebuild the Docker images with the zipkin profile, for blog-app, store-app, and gateway-app with the following Maven command:
./mvnw package -Pprod -Pzipkin verify jib:dockerBuild -DskipTests
ProTip: If you’re on a system with bash shell, like Linux or MacOs, you can do this from the
jhipsterfolder to build each project at once:for i in blog gateway store do cd $i ./mvnw package -Pprod -Pzipkin verify jib:dockerBuild -DskipTests cd .. done
Run the Monitored Microservices Architecture
Are you ready for the best? Go to the docker-compose folder and start the services with the following command:
docker-compose up
You will see a huge amount of logging while each service starts.
jhipster-registry_1           | ----------------------------------------------------------
jhipster-registry_1           | 	Application 'jhipster-registry' is running! Access URLs:
jhipster-registry_1           | 	Local: 		http://localhost:8761
jhipster-registry_1           | 	External: 	http://172.20.0.2:8761
jhipster-registry_1           | 	Profile(s): 	[composite, dev, swagger, oauth2]
jhipster-registry_1           | ----------------------------------------------------------
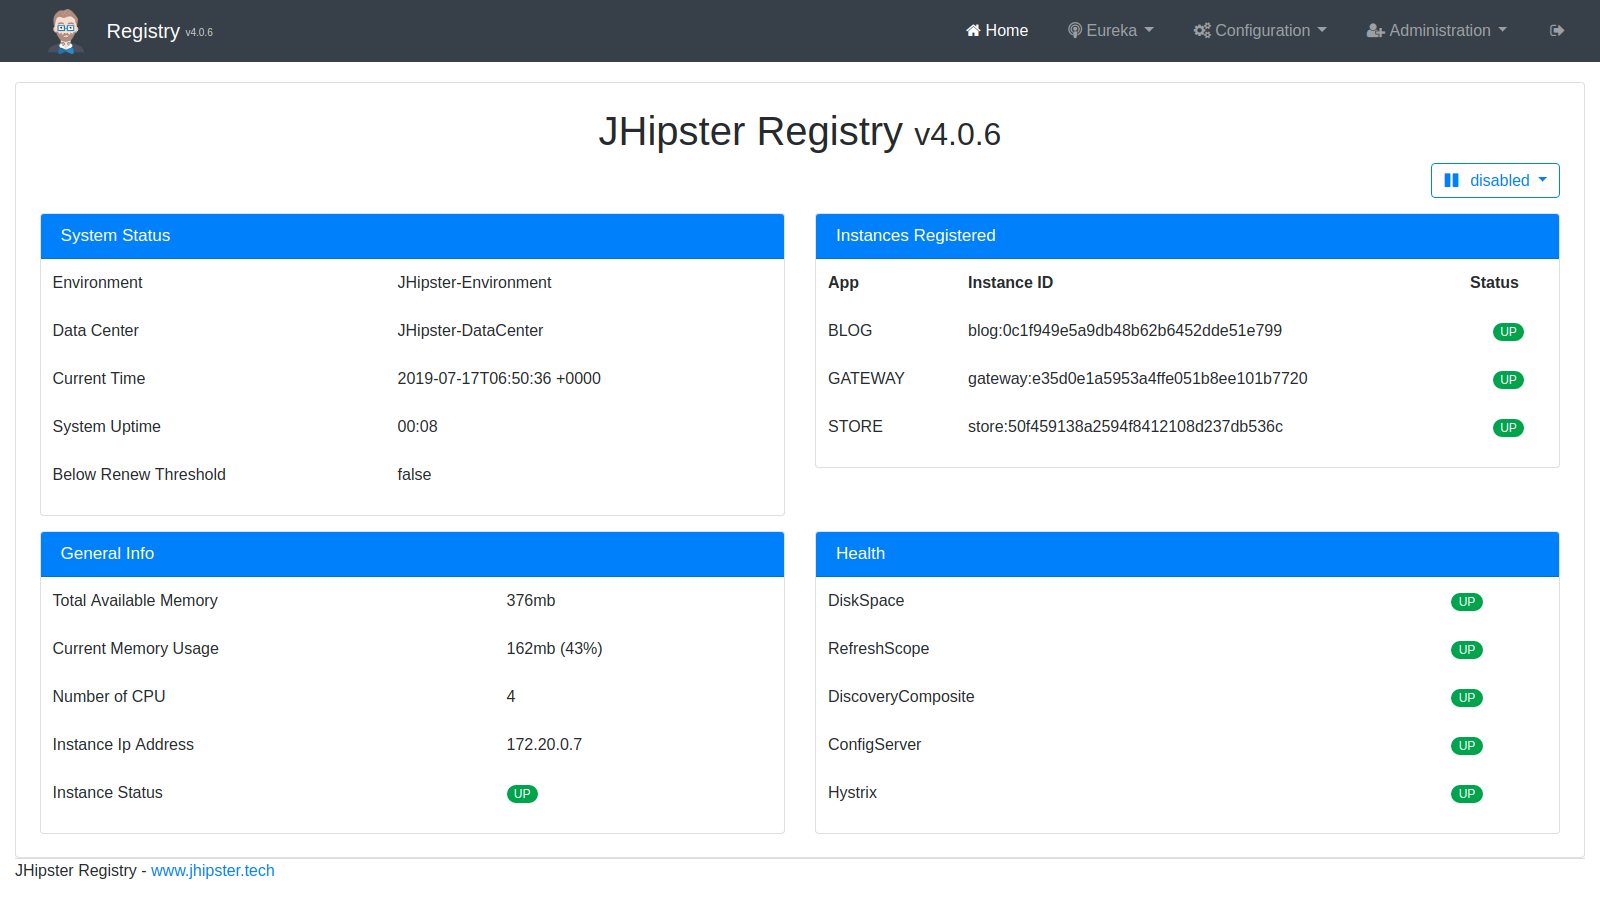
Log into the JHipster Registry at http://localhost:8761 with Okta user credentials and check the service’s health.
Once all the services are up, log in to the gateway application and create some blogs and posts to generate traffic. To do this, use the Entities menu at the top left of the application. The gateway home is at http://localhost:8080.
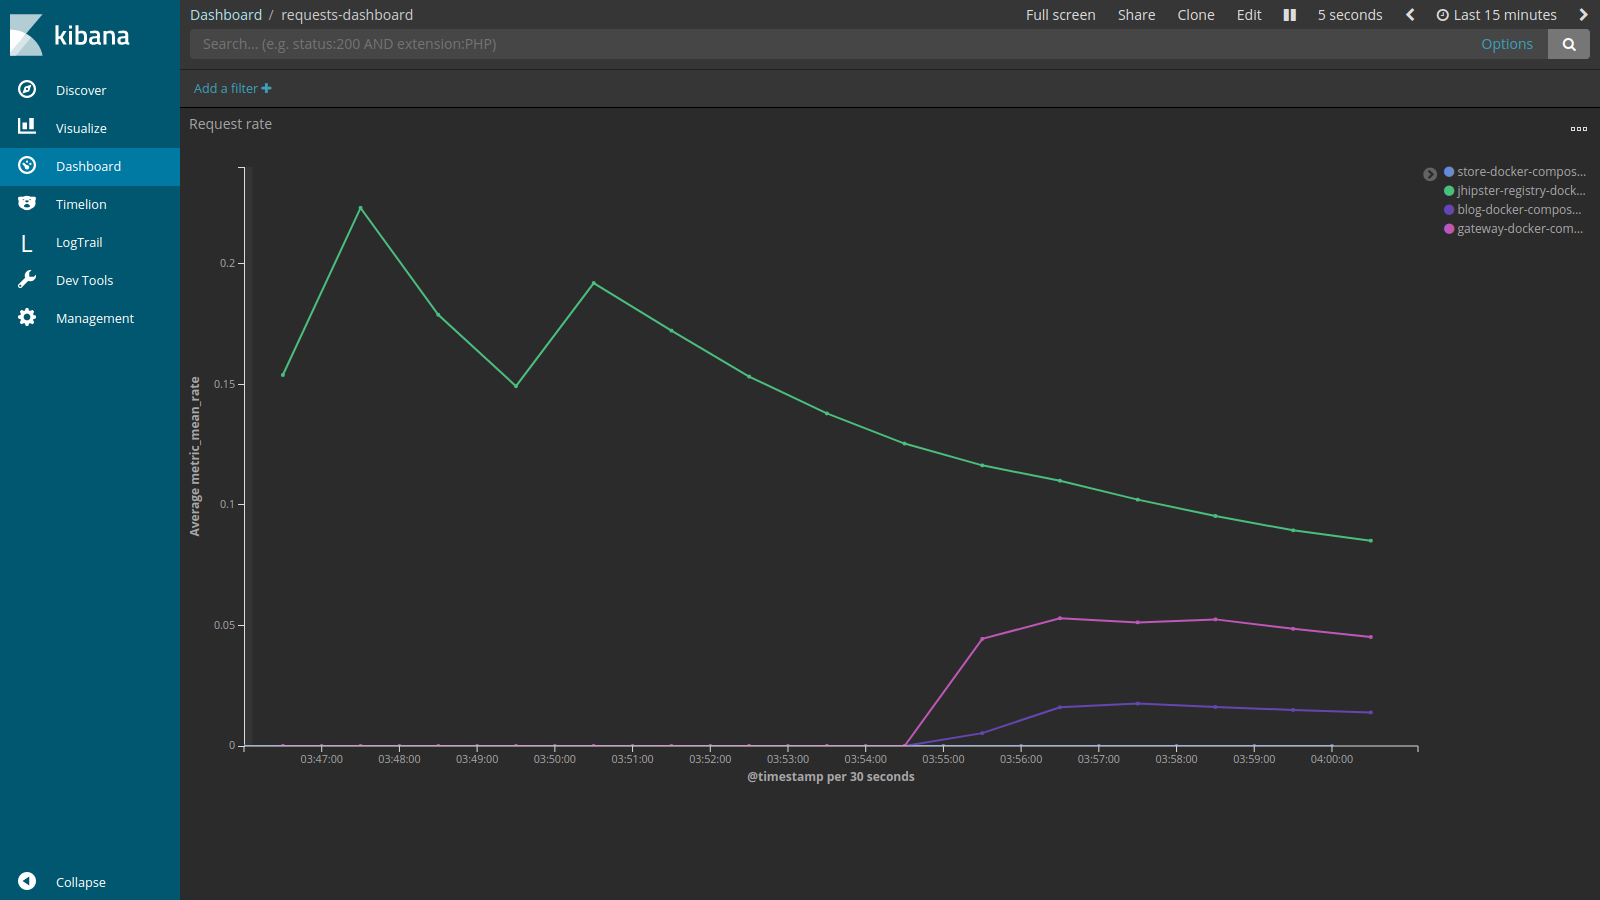
The fun part! Access the JHipster Console at http://localhost:5601. Go to the Dashboards section, and open the requests-dashboard. You should see some nice curves:
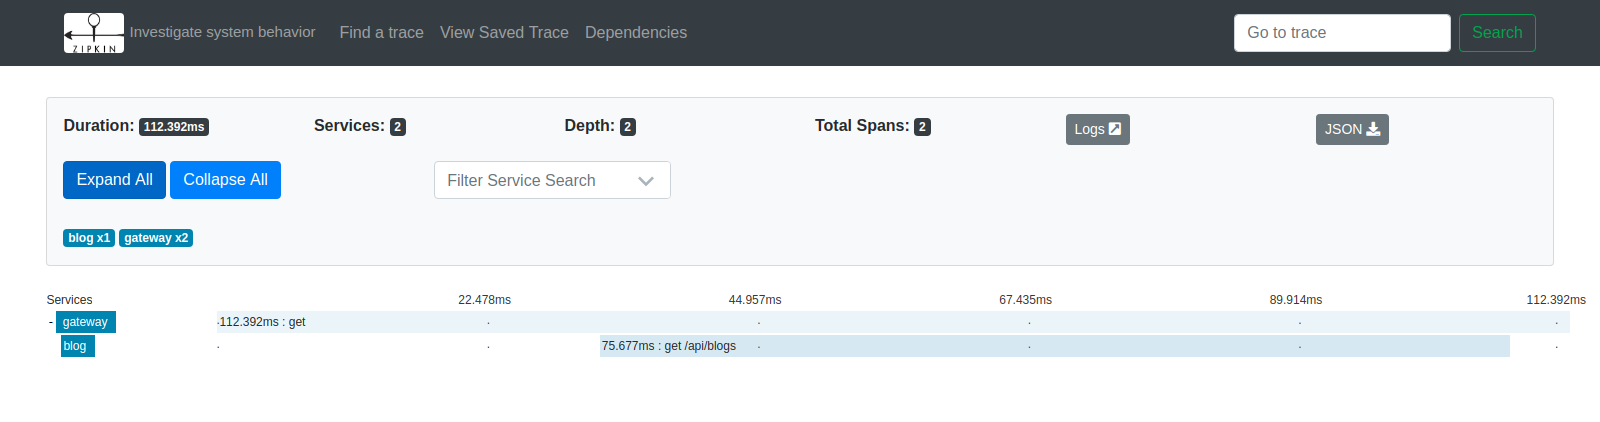
Since you integrated the JHipster Console with Zipkin UI, in the traces-dashboard, you can find the longest traces duration on the left. If you click on a traceId on the right, it will open the trace in the UI and you will be able to examine the flow.
Learn More About JHipster and Elastic Stack
I hope you enjoyed this tutorial and the power of the Elastic Stack and the JHipster Console for monitoring a microservices architecture. To continue expanding your knowledge on JHipster monitoring and Okta integration with the Elastic Stack, check out the following links:
- JHipster Console on GitHub
- JHipster Monitoring Documentation
- SAML Authentication and the Elastic Stack
- Authentication in Kibana
If you liked this post, chances are you’ll like our other posts on JHipster and microservices:
- Better, Faster, Lighter Java with Java 12 and JHipster 6
- Upgrading Spring Security OAuth and JUnit Tests through the 👀 of a Java Hipster
- Java Microservices with Spring Boot and Spring Cloud
- Java Microservices with Spring Cloud Config and JHipster
- Secure Reactive Microservices with Spring Cloud Gateway
To be notified when we published new posts, follow @oktadev on Twitter. We also publish screencasts to our YouTube channel on a regular basis.
Okta Developer Blog Comment Policy
We welcome relevant and respectful comments. Off-topic comments may be removed.