Performance Testing with Apache Bench

Every web developer I know is concerned with the performance of their web applications. How fast will my app load? Will it handle a lot of users? How well will it lots of data? Will it scale? These are just some of the questions that developers ask themselves but very rarely have any idea how to test.
Generally, when performance testing, most developers worry about “load testing”, or how an app will perform under load. So that’s where I will start my guide to performance testing.
Apache Bench is a command-line application for simple load testing on a website. In this post, I’ll walk you through the basics of how to measure your web application’s performance in a simple, straightforward way.
Run Your First Apache Bench Load Performance Test
If you have access to a Mac or Linux system, chances are you already have Apache Bench installed as a program called ab. Run a simple load test with:
ab -n 100 -c 10 https://google.com/
NOTE: If you don’t have
abavailable on your system, you’ll likely need to install theapache2-utilspackage via your distro’s package manager. If you’re on Windows, just download the Apache Binaries .zip file, extract it, and copy theab.exefile wherever you need it to be.
This command tells ab that you want to simulate 100 connections (-n) over 10 concurrent threads (-c) to the https://google.com/ URL.
If you run this and get the error
ab: Invalid URL, you probably forgot the trailing slash in the URL. The URL parameter expects a base URL and a path. In this case, it’s the root path/, where the trailing slash is required to make it a valid URL.
Read the Performance Test Results from Apache Bench
When I ran the previous command, my output looked like this:
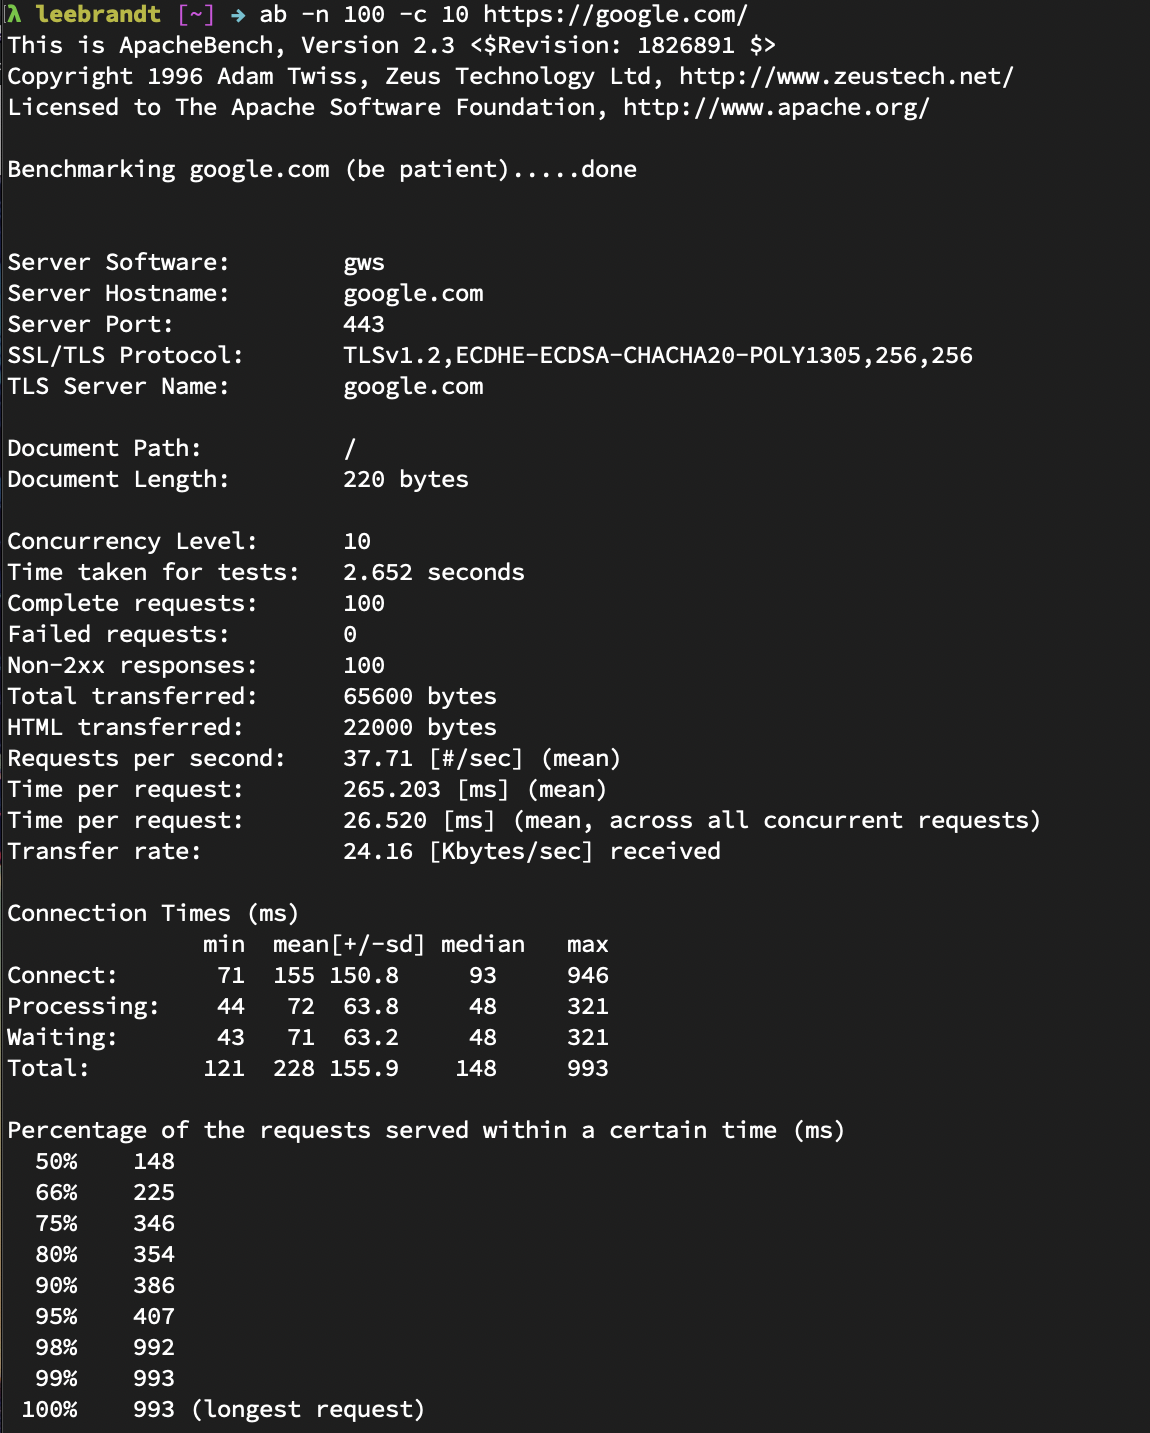
This gives me quite a bit of information about the load test run:
- Webserver
gwsor Google Web Server, the server software in Google’s infrastructure - Hostname
google.com - Port 443 for TLS version 1.2
- Document size 220 bytes
- Document path was the root path (
/)
I told ab to use 10 concurrent threads for the 100 connections, and all tests completed in 1.907 seconds. Even though all 100 requests returned Non-2xx responses (Responses in the 200 range are the “okay” range), it says none of the requests failed. How is that possible? Chances are I got all HTTP 30x results, assuming that Google is redirecting to the google search page on requests. If all the requests had returned 2xx HTTP statuses, this line would not appear in the results.
The total number of transferred bytes (bytes received from the server for all requests) was 65600 bytes. This number includes HTTP headers. The total HTML bytes received from the server was 22000, which excludes information sent in the headers. Apache Bench sent 52.44 requests per second to the server at ~190 mean milliseconds per request. The second per request value there takes into consideration the concurrency. In other words, concurrency * timetaken * 1000 / done instead of just timetaken * 1000 / done. Then ab takes that formula to determine the number of Kb/sec of data received from the server.
The Connection Times block gives you information about each connection, like how much time it took to make the connection request, and how much time the site spent processing and waiting.
The last block is pretty self-explanatory. It breaks down the requests by time, letting you know that 50% of the requests finished in 148 milliseconds, 66% were done by 225 milliseconds, and so on down to the longest request time of 993 milliseconds.
Guidelines for Performance Testing
If you use ab to help gauge the performance of your web application, I have a few suggestions to make your life easier. These rules apply to almost any performance testing scenario, regardless of whether you use Apache Bench.
Automate Performance Tests
While manual testing is OK, automated testing is much better, like your unit and integration tests, your application should also have a set of performance tests. Automated performance testing is especially helpful in larger teams, where it may not always be obvious which changes to the codebase might be impacting overall application performance.
Setting up automated performance testing can be easy. For example, in your continuous integration system, you can automatically run an ab test once your unit and integration tests have finished. You can then parse out the metrics you care about and fail the test if performance has degraded beyond a certain point.
Pick a Success Metric and Stick to It
The next rule of automated testing is to decide on a success metric before doing any sort of testing. What does success look like, specifically?
There are many metrics to obsess over in the performance testing world: byte size (how much data are you transmitting to the client on every request?), throughput (how many requests per second can your application sustain before degrading performance?), resiliency (will your application start failing under a certain amount of load?), connection time (how many milliseconds does it take for a client to receive a response from your application?), etc.
As a rule of thumb, I like to look at the total median connection time. This metric represents the number of milliseconds it takes for a client to send and receive a response from your application. This is as close to real-world performance as you’re likely to get, without more sophisticated tooling, and can be used as a starter metric if you’re unsure of what to test.
Define a Failure Condition
The final rule of performance testing is that you should always define a failure condition for your tests. Even the most sophisticated automated performance tests are useless if you don’t define what a test failure means.
For example, maybe you want your automated performance tests to fail if your total median connection time is greater than 100ms. Or maybe you want your automated performance tests to fail if the total median connection time is 10% longer than it was during the previous test run.
Other Types of Performance Tests
As I mentioned, you can also use Apache Bench to run other types of tests under the “Performance Testing” umbrella.
ab can also help with stress testing. You can send a number of requests with a large post payload to a particular page on your website to see how it handles a lot of data. This can be handy in determining max file size uploads, etc.
You can also conduct scalability testing by running ab with requests or payloads that might trigger your infrastructure to scale up and down. Think about Kubernetes clusters of Docker containers that have rules to add new instances when the request load reaches n concurrent requests, and scale back when the load recedes. Pretty cool, huh?
Be Cautious When Performance Testing
As you might imagine, running an intense load or stress test can pose problems in a production system. These tests are basically Denial of Service (DoS) attacks. If there is infrastructure in place to help prevent these types of attacks, running a load, stress, or scalability test might trigger countermeasures. You should coordinate with the people responsible for infrastructure and administration when running any kind of performance test against a server that they manage or maintain. They’ll be much less likely to hate you if you do.
Learn More
If you want to learn more about Okta and software development in general, check out some of our other awesome content!
- How to Develop a Quarkus App with Java and OIDC Authentication
- Reactive Java Microservices with Spring Cloud Gateway
- How to Build a Heroku Add-On
- Why Should You Migrate To .NET Core 3.0?
As always, feel free to leave comments below. To make sure you stay up to date with our latest developer guides and tips follow us on Twitter and subscribe to our YouTube Channel!
Okta Developer Blog Comment Policy
We welcome relevant and respectful comments. Off-topic comments may be removed.