Debugging JVM Performance Issues at Okta

Our customers here at Okta expect a highly-available service that is always there when they need it. We’ve worked hard to design a service architecture that allows us to deploy code and do maintenance without disrupting our customers in any way.
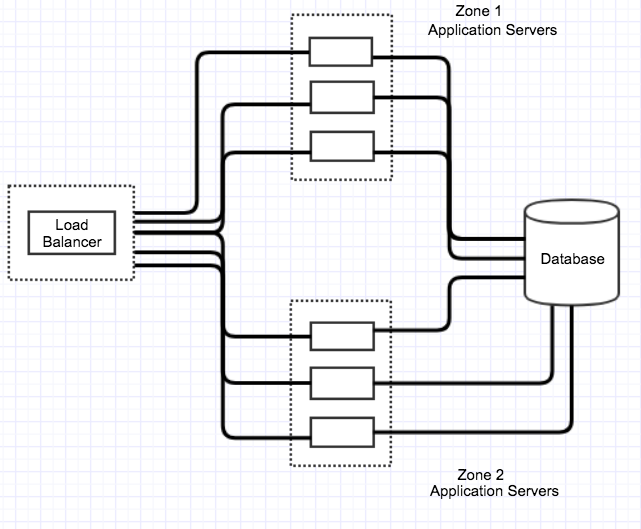
How do we achieve that? If we examine one slice of our core service, we have a reverse proxy set up in front of a fleet of Java application servers. When we need to do a deployment to those servers, we toggle groups of servers out of use, deploy the new code, then bring them back in.
We recently finished working through an issue where this process would cause a small number of seemingly-random errors to be returned to our customers. These errors would appear during a small window following the re-introduction of our newly deployed servers. Our monitoring systems would inform us that we had just responded to a small number of requests with an HTTP 502 response code – the dreaded “Bad Gateway” response. Although the number of errors was small, we expect that number to always be zero since we have enough capacity to serve every single request. This was a troubling realization – anyone who has done deployments on live infrastructure knows how important it is to have complete confidence that your hosts are truly ready when you expect them to be.
This error itself is generic; it is an indication that “something” went wrong when we tried to handle the request – though not the more explicit failure of an HTTP 500. There were a few obvious places to start looking. Were the new servers not actually ready? Maybe our health checks weren’t adequate. Were some of the caches on these servers not sufficiently warm upon first use? Maybe we could give them a little bit of help. For that matter, maybe we could even ease these servers into use while their more seasoned peers took the brunt of our traffic.
At this point, we were also in the unenviable situation of having an issue that only appeared in production environments. Moreover, it only appeared in our busiest environments. There are many invasive debugging techniques that are not practical (or even feasible) to employ on a production server, so we pursued a dual-track approach of non-invasive investigation in production alongside attempts to reproduce the issue in test environments. It would turn out that reproducing the exact issue was arguably the most difficult part of the whole process!
Let’s Blame Tomcat
We knew that our reverse proxy layer (NGINX) for this service would log this message when the error occurred:
[error] 8027#0: *3939315 recv() failed (104: Connection reset by peer) while reading response header from upstream, client:xx.xx.xx.xx, server: _, request:
This pointed directly at the Tomcat server we were sending the request to as the root of the problem. By selecting a TCP connection from one of these Tomcat servers to the NGINX proxy:
lsof -np $(pgrep -f tomcat) | grep {IP_LOAD_BALANCER} | grep EST | tail -1
java    27967 tomcat  721u  IPv4           41813378        0t0  	TCP {IP_TOMCAT}:concomp1->{IP_LOAD_BALANCER}:59888 (ESTABLISHED)
and then (in a test environment) forcibly closing the connection:
# gdb -p $(pgrep -f tomcat)
(gdb) call close(721u)
$1 = 0
We were able to observe the same error logged at NGINX, with the expected accompanying HTTP 502 returned.
For each of our main suspects, we went through and performed experiments to rule them out. Well, actually we performed the experiments in the hope that we could pin the problem on one of them, but we ended up ruling each of them out:
- Brand new servers – reduce the load at the outset
- Server caches – try to warm them up “manually”
- Server capacity limits – over- and under-provision servers, while monitoring everything
Brand New Servers
The NGINX has a setting (slow_start) to allow for time-based weightage for the new servers. Using this feature allows new servers to ease into a full traffic load, rather than being immediately bombarded. We set the slow start time to 5 minutes but saw no difference in behavior.
Server Caches
Newly-restarted servers have many layers of cache initialization and other optimizations that are typically performed as they receive traffic. In the past we have seen issues with some of the JVM’s compilation and optimization features around startup time while also under high load. We put together a battery of API requests and ran it against one of these newly-restarted servers right after it was restarted, but before it had been put into use for production traffic. When we then put it in use for production traffic, we saw no reduction in the errors.
Server Capacity Limits
At the time we were experiencing this issue, part of our deployment choreography was to disable serving some static content from our CDN – which meant the Tomcat process on our servers needed to serve it. We thought this might be exceeding some hardware constraints on the server, so we ran tests with and without the CDN while monitoring many OS- and device-level metrics (sar, iostat, vmstat, netstat, etc.).
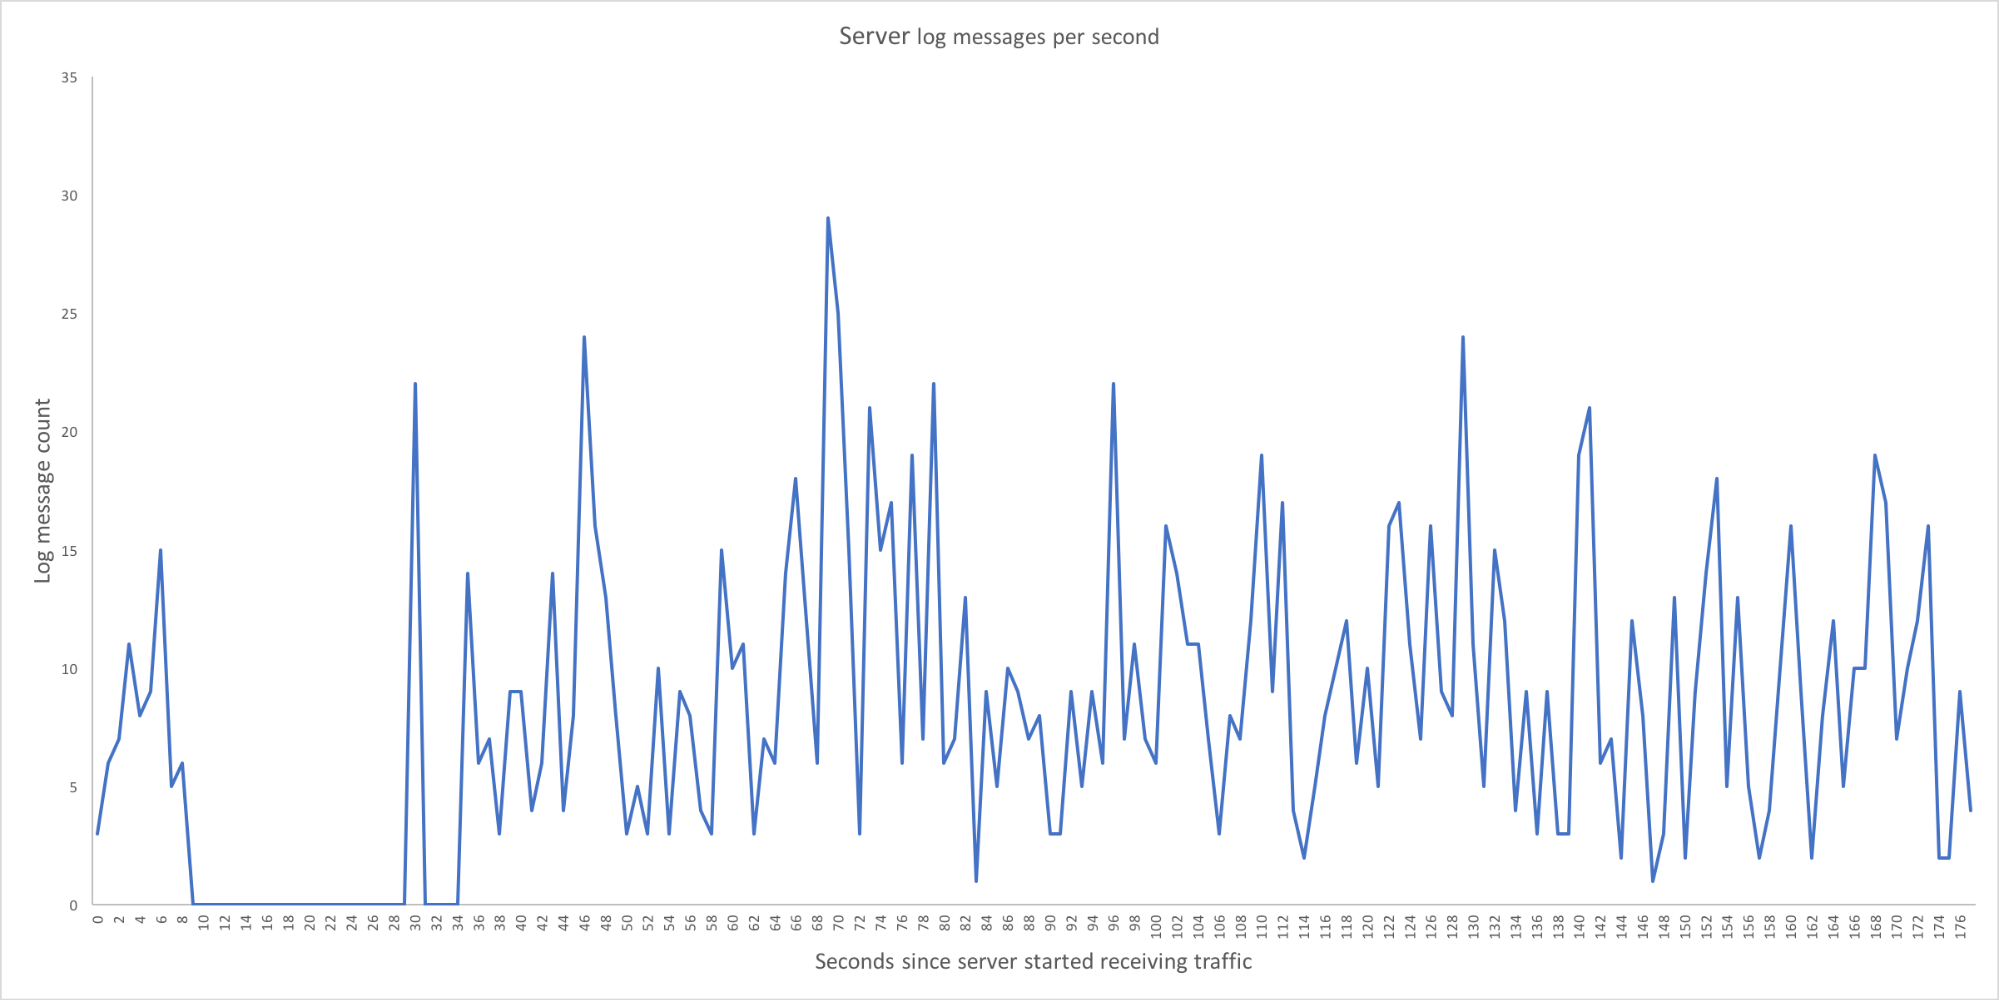
Still nothing – the server had plenty of headroom on all metrics we observed. While we were monitoring the servers during these tests, we noticed that a few seconds after the server became live, the log messages on the server went silent. All the logs went silent. The log messages throughput graph below shows this behavior.
Actually, Let’s Blame the JVM
At this point in our investigation we knew that:
- There were no messages in any log written by the JVM right before the 502 errors appeared
- Tomcat was snapping the connection back to the NGINX reverse proxy
- The Tomcat process did not respond to JMX commands during this pause of log messages
- The operating system itself had no apparent resource constraints
After we noticed that every single log JVM had a gap in it right before these errors appeared, we ran a diagnostic script that would show CPU usage by native thread at periodic intervals. It would also take thread dumps on our Tomcat process so we could cross-reference. We saw that at the time of the pause, the “VM Thread” occupied one full core on the server – and nothing else of note was happening.
Sample output of our diagnostic script:
Thread id: 16348\. Native id:3fdc in thread dump has cpu: 100.1
-----------------------------------------------------------
"VM Thread" os_prio=0 tid=0x00007f30200f1800 nid=0x3fdc runnable
Reproducing the Issue with JMeter
While all this analysis (which is slow-moving in production environments) was going on, we were still trying to reproduce the exact issue in a controlled test environment. Okta’s API space is broad, and it was clear to us at this time that the contrived traffic we were using was not sufficiently complex to trigger this problem.
In our production environments, we have thousands of large customer deployments which are all unique in their traffic patterns, volume, and configuration. In our test environments, we have synthetic tests that cover a large swath of this API space, but they are run from an external service at low volume on a schedule.
We decided to capture the TCP traffic for several hours in our synthetic test environment, then play it back many times over using JMeter. At long last, we were able to reliably observe a 2-4 second pause in all apparent activity on one of our servers. While this pause was not quite as long as we were seeing in production, it had all the same other characteristics.
Safepoints and the JVM
With the combination of knowing that the entire JVM was paused and that it was paused because its “VM Thread” was hard at work, we had a pretty good handle on where to go next for the root cause.
The JVM’s VM Thread is responsible for multiple internal tasks in addition to some aspects of the garbage collection (GC) process. Garbage collection is probably the closest that most developers will ever need to come to caring about a safepoint, which is a JVM mechanism to allow safe manipulation or examination of the machine state.
Operations requiring a safepoint – which include GC, code deoptimization, and biased locking revocation – are typically abstracted away from general development, though some of them are explicitly requested (for example, when you take a thread dump). The exact implementation of some VM Thread operations will depend on which JVM you are using, but within OpenJDK-based systems, many will require a safepoint and therefore a “stop-the-world” pause.
The available information about safepoints and their associated pauses is mostly centered around garbage collection and as a result, there is a wealth of information about helpful JVM flags and how to interpret the resulting GC logs. For non-GC safepoints, there are a few flags available that can help, but information about them is relatively sparse:
-XX:+PrintGCApplicationStoppedTime
-XX:+PrintSafepointStatistics
-XX:PrintSafepointStatisticsCount=1
These gave us the information we were missing; the following line appeared in out GC logs, alongside the normal GC information we had all along. Note that these logs are from our test environment – in our production environment these pauses were observed to be 20-40 seconds at times:
2018-11-16T22:08:00.638+0000: 462.914: Total time for which application threads were stopped: 3.4767356 seconds, Stopping threads took: 0.0041299 seconds
It is interesting to note here that reaching the safepoint took almost no time at all (in high-concurrency applications this step can often take a significant amount of time). Almost all the pause time was spent actually performing some VM operation. The additional information that was logged to stdout was more descriptive:

Here’s the same output for RedefineClasses organized in a table to be more readable:
| Threads | ||
|---|---|---|
| total | initially_running | wait_to_block |
| 388 | 5 | 9 |
| Time | ||||
|---|---|---|---|---|
| spin | block | sync | cleanup | vmop |
| 3 | 0 | 4 | 0 | 3471 |
Our application was pausing for over three seconds to perform a “RedefineClasses” operation!
The ability to redefine a class within the JVM is part of the Java Virtual Machine Tool Interface (JVMTI) and it is often used for instrumenting code. Okta, like many other SaaS companies, runs a Java agent plugged into a main Java process; this helps us gather detailed diagnostic and performance information about the main process.
The root cause of this issue was traced to this agent making requests to transform a huge number of classes. The transformation itself was benign – it just added some instrumentation. Unfortunately, in this case, the agent happened to be choosing to perform this redefinition at a time that was typically a few seconds after our servers were subjected to production traffic. The agent also would batch up so many classes to retransform that it required the 20-40 seconds we were observing.
In the end, we chose to disable a particular piece of this agent’s functionality to resolve this issue. While we did lose a small portion of the agent’s functionality by doing this, we deemed it the safest and quickest resolution option and have seen no sign of this issue since then.
After going through this process, there are a few things in hindsight that would have put us in a much better position to quickly resolve this issue:
Have a good system in place to produce (and collect!) JVM-level performance data. For years we have been producing and saving garbage collection information, but these additional safepoint logs were not a part of that system. Enable your engineers to observe fine-grained system metrics for your production servers. It’s common to have access to basic metrics that are updated periodically, but some situations call for metrics that are collected as frequently as every second. Lastly, don’t underestimate the impact a Java agent can have! They have a lot of potential impacts that are not just “CPU overhead” for your application.
Learn More About Safepoints, the JVM, and Building Secure Java Apps
Trying to solve a similar problem? Just interested in learning more about app development in Java? We’ve got some great resources for you:
- Logging Stop-the-World Pauses in JVM
- Under the Hood JVM: Safepoints
- Safepoints: Meaning, Side Effects, and Overhead
- Learning Java as a First Language
- Better, Faster, Lighter Java with Java 12 and JHipster 6
Looking for even more awesome Java and Spring Boot resources? Follow us on Twitter or subscribe to our YouTube channel for the latest from the @OktaDev team and all our friends!
Okta Developer Blog Comment Policy
We welcome relevant and respectful comments. Off-topic comments may be removed.