How to Write Cleaner, Safer Code with SonarQube, Docker and .NET Core
When it comes to code quality and code security, SonarQube is your teammate! This analysis tool is pretty straightforward to use, especially with some help from Docker.
In this post, I’ll show you how to run a Docker container with SonarQube to analyze the code of a simple ASP.NET Core 3.0 application. Code analysis is a critical component of app development because it can identify security issues and other tricky bugs that might be overlooked until unexpected behavior impacts end-users. Let’s take a look.
What Is SonarQube?
In addition to evaluating the overall health of an application, SonarQube can highlight issues and bugs in the code. With a Quality Gate in place, you can Clean As You Code and improve code quality systematically. Even more, this tool facilitates planning and allocating tasks for a group of programmers.
SonarQube can help measure progress easily and validate the importance of technical work that’s difficult to view or demonstrate, especially with non-technical customers. Let’s explore some of the benefits of SonarQube and how you can implement it in your workflow.
Table of Contents
- What Is SonarQube?
- Key Features of SonarQube
- Prepare the SonarQube Environment
- Analyze Your Project with SonarQube
- Analysis Results in SonarQube
- Additional Configuration and SonarQube Customization
- Code Analysis Matters
Key Features of SonarQube
Before we get started on the tutorial, here are some of the capabilities of SonarQube that make it useful for automating code review in .NET Core:
- Quality Gate lets you set an acceptable quality standard for merging branches and releasing applications to production.
- Code analysis is presented graphically and transparently. Programmers and non-programmers alike gain visibility into coding progress.
- You gain the insights needed to analyze bugs, security vulnerabilities, and code duplication.
- Quickly prioritize code changes and improvements.
- SonarQube doesn’t just pinpoint predefined code quality issues. If you wish, you can create custom rules to monitor specific issues.
- Support for more than 27 programming languages. SonarQube continues to offer a free and open source Community Edition, along with several Editions for commercial use.
Prepare the SonarQube Environment
Install Java and Docker
To use SonarQube, first prepare your environment. The requirements are pretty simple, a Java SDK for starters. We also recommend using Docker; a popular approach nowadays. If it’s your first experience with Docker and you have doubts or questions, there are many excellent online learning resources including A Developer’s Guide to Docker on this blog.
-
Since SonarScanner uses Java, you’ll need to add a Java SDK (Java 11 or later) to
PATH, and you’ll addJAVA_HOMEto your system variables. Download the right version of the Java SDK for your system. During the process, you should accept the default settings. This way all required elements are added to the system variables. -
Docker provides a popular way to run many solutions without huge effort. You can download Docker and install it by following the instructions included in the link. The install process is straightforward and you should not anticipate any difficulties.
Set Up a Sample Application
You can use any application you like, but a sample app comes along with this post. If you choose to work with your own project, simply skip this step.
Next, we need an application to analyze with SonarQube. You can use any application you choose, or you can run the example app I built for this tutorial:
Run
$ git clone https://github.com/oktadev/dotnet-sonarqube-example
And now we’re ready to see what SonarQube can do.
Analyze Your Project with SonarQube
Run SonarQube on Docker
Start the SonarQube server with the following command:
docker run -d --name sonarqube -p 9000:9000 -p 9092:9092 sonarqube
After you log in the first time (initial credentials are login: “admin” with password “admin”), you’ll be prompted to change the password.
Install SonarScanner for .NET Core
- Download SonarScanner from GitHub. You don’t have to run analyses with user credentials, you can generate tokens instead. For quick setup in this tutorial, we won’t cover the token approach, but you can learn more about user tokens in the SonarQube documentation.
- Add the path of the extracted SonarScanner folder to your
PATHenvironment variable. - Run the command:
dotnet tool install --global dotnet-sonarscanner
NOTE:You can read more about this setup process in SonarQube documentation.
Analyze the Code
To run SonarScanner, run the following commands:
dotnet sonarscanner begin /k:"project-key" /d:sonar.login=admin /d:sonar.password=admin
dotnet build <path_to_solution.sln>
dotnet sonarscanner end /d:sonar.login=admin /d:sonar.password=admin
NOTE: Remember to replace “path_to_solution” and “password” with correct ones for your example.
Analysis Results in SonarQube
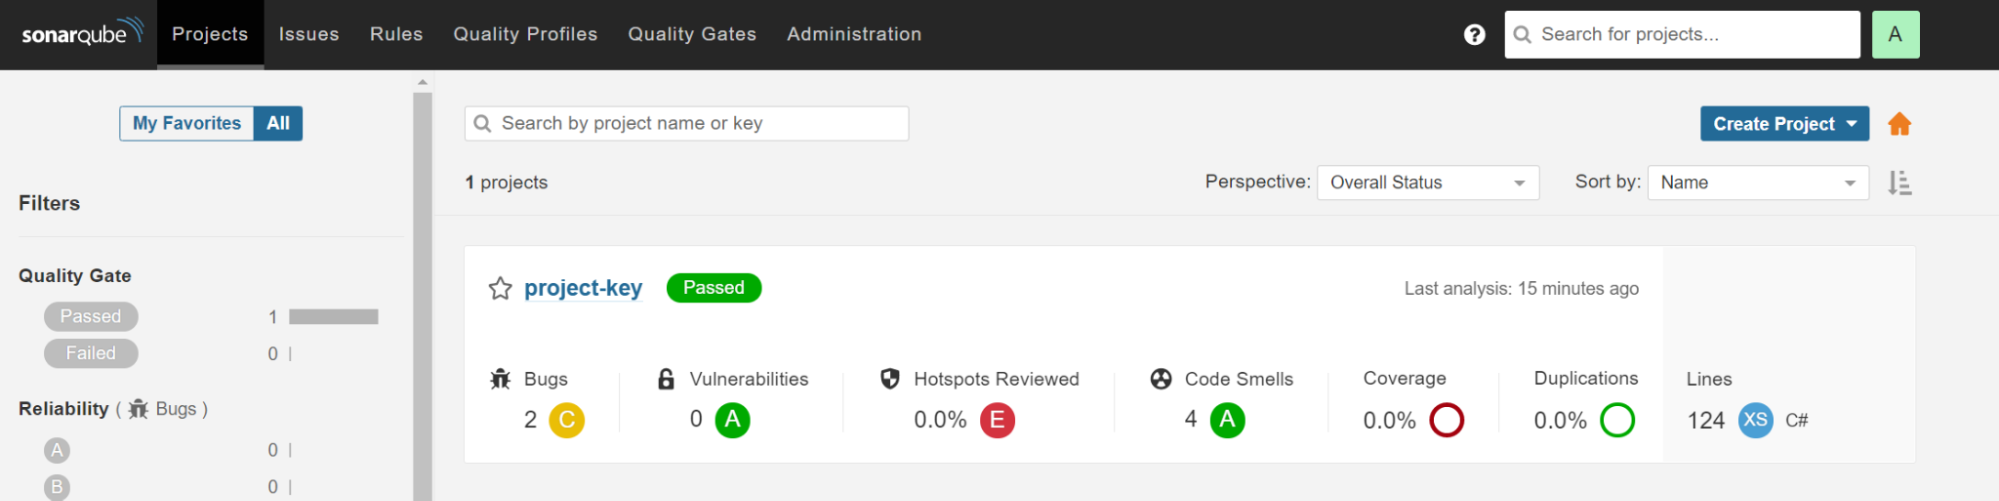
Take a look at the main view of SonarQube by going to http://localhost:9000. The configured Docker container is exposed on that port. This view presents general information, such as counters for bugs, vulnerabilities, and code smells or number of code duplications. It’s the simplest view - no-frills metrics.
You’ll find more detailed reports in the Measures section.
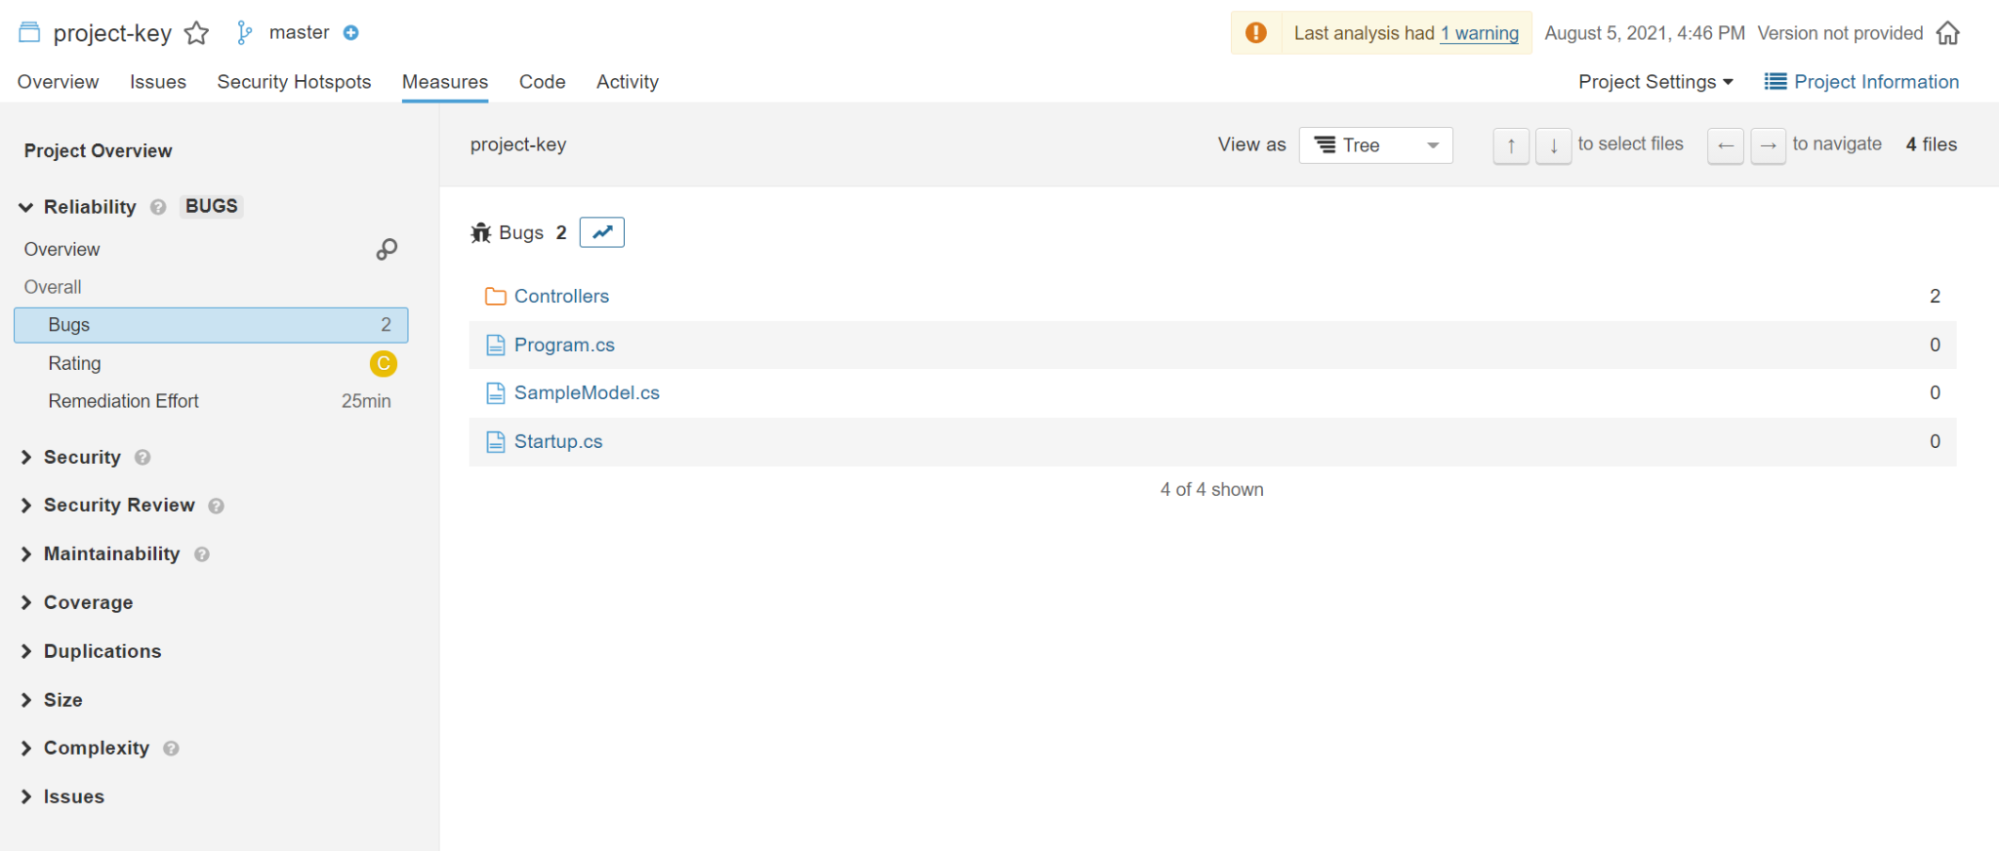
For example, it’s possible to determine how many bugs each project file contains and preview the problematic lines of code.
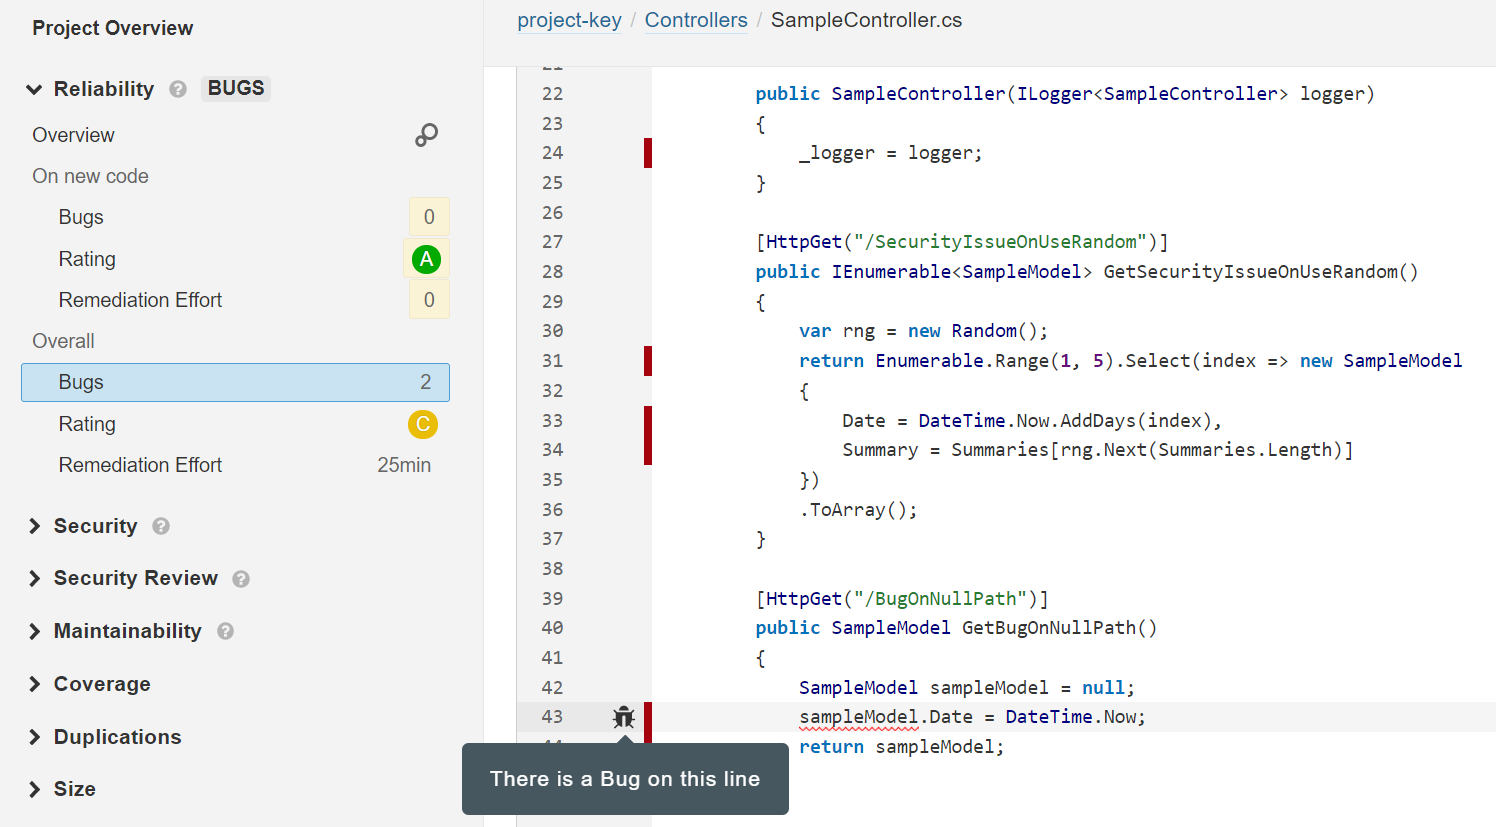
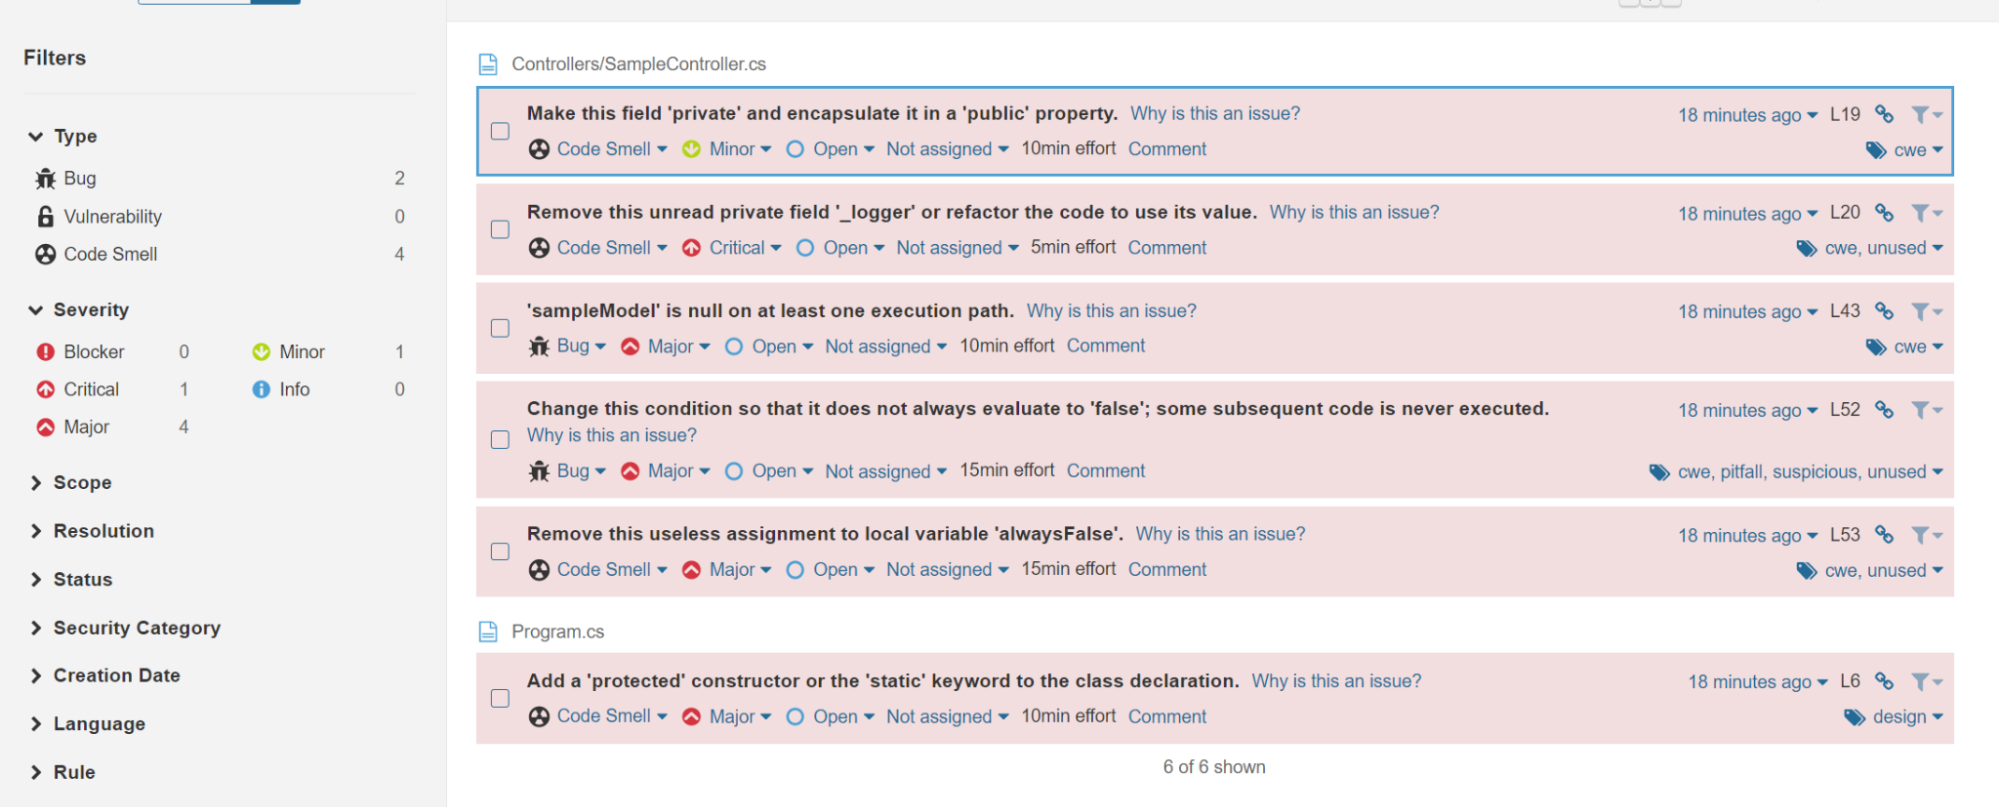
The Issues section lets you go deeper into analysis of the source code. SonarQube reports on all possible problems: from minor issues to critical bugs. You can explore every issue in the code that you should take into consideration, along with an explanation of the issue and an estimated time for solving it.
Additional Configuration and SonarQube Customization
SonarQube will run on almost any stack. For this reason, you may notice some unwanted notifications. Pre-set rules may not work correctly in all frameworks, and may not know how to handle all file extensions.
Adding custom rules and configuration is a straightforward process, similar to excluding files or paths in GitHub. You can apply custom rules globally for your system or locally for a single project. To be precise, you can:
- Completely ignore some files or directories
- Exclude files/directories from Issues detection (via specific rules or all of them), but analyze all other aspects
- Exclude files/directories from Duplications detection but analyze all other aspects
- Exclude files/directories from Coverage calculations but analyze all other aspects
In order to make adjustments, go to Administration > General Settings > Analysis Scope (global settings) or Project Settings > General Settings > Analysis Scope (local configuration).
You can learn more about project administration in the SonarQube documentation.
Code Analysis Matters
We just explored how to set up SonarQube quickly and without too much effort. The solution we stepped through in this tutorial was based on .NET, however, you can easily apply it to over 20 other popular programming languages.
As a developer, it’s important to stay focused on code quality, especially with tools like SonarQube that make it easier than ever to analyze code and learn best practices for code security and resilience. In the workplace, it’s also essential for developers to produce code that integrates gracefully with the work of others—and with SonarQube as a teammate, coding can become even more of a collaborative team sport. 😉
If you enjoyed this post, you might like related ones on this blog:
Follow Okta Developers for more great content and updates from the team! You can find us on Twitter, Facebook, subscribe to our YouTube Channel, or start the conversation below.
Okta Developer Blog Comment Policy
We welcome relevant and respectful comments. Off-topic comments may be removed.