How Okta Chased Down Severe System CPU Contention in MySQL
Sometimes fixing a problem causes or reveals a new one. And sometimes this sets off a chain reaction of problems and fixes, where each solution exposes a deeper issue. In technology, cascades like these are common, often painful, and occasionally welcome.
Our battle against CPU contention last fall is a good example of such a cascade. What began as a buffer pool adjustment triggered a series of issues and fixes that generated plenty of stress, but ultimately strengthened our platform.
Underlying each of the challenges we faced in that period was the huge amount of business our Sales organization had closed in late summer and early Fall of 2014. Growth brought a dramatic increase in the number of new customers running large import jobs and new orgs running agents.
As problems go, growing pains are good problems to have. But they usually come at a cost: the increased traffic caused significant CPU contention, as shown in the following image.
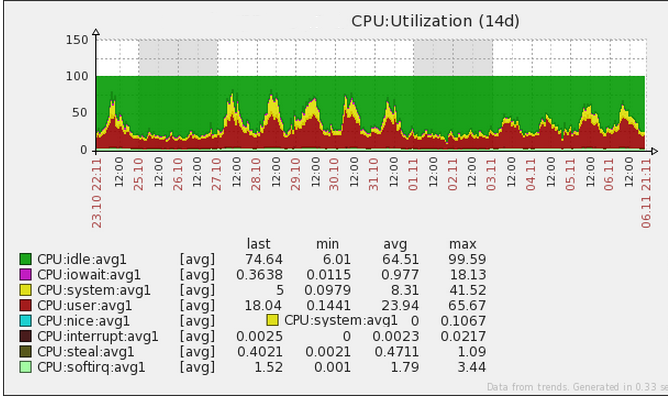
Those red and yellow spikes in late October, 2014 seized our attention and spurred an aggressive response from Okta’s site operations team. The team took immediate action to prevent this situation from getting worse and potentially causing a issue with our site.
Tuning the database
As a first step, we tuned our MySQL database to fully utilize the amount of RAM in our server instances. We had been running with a relatively small buffer pool compared to the amount of available RAM, which meant that we were sacrificing both performance and money. Increasing the size of the buffer pool decreased page response times and nearly eliminated disk reads.
Doubling hardware resources
Despite the buffer pool adjustment, we continued to see significant CPU contention. In response, we doubled the size of our servers (244 GB of RAM, 32 CPU cores, and 2 x 320 GB HDDs). CPU contention decreased (see the trough in the following image), but probably because of the Thanksgiving holiday, not the additional hardware.
After the holiday, CPU spikes returned, now worse than ever. Page render time slowed down, queries against the database took longer, and jobs backed up.
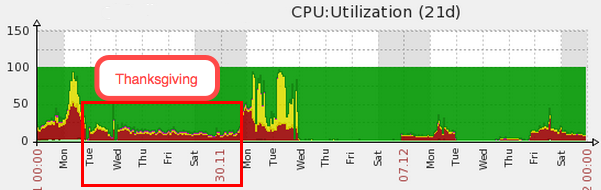
Note: Flat areas in the graph showing no CPU usage indicate periods when we were running on a secondary server.
Why did CPU contention increase after we’d doubled the CPUs? Shouldn’t it have decreased?
Kernel mutex bottleneck
The alarming amount of yellow in our graphs showed extremely high system CPU usage (and user CPU usage was also too high). Clearly, the operating system was working very hard at something. The metrics we pulled revealed that all the InnoDB threads were busy waiting on the kernel mutex. We had known that kernel mutex was a bottleneck even before we’d doubled hardware resources, but we hadn’t understood why.
A closer look at the MySQL source code showed that kernel mutex was trying to allocate memory to all of our transactions. This is perfectly normal behavior, but it proved to be very limiting in our case because we perform approximately 85,000 transactions per minute. The kernel has to create a transaction ID for each transaction and allocate a tiny block of memory in RAM before giving it to the thread handling the transaction.
Now we knew why doubling the number of CPUs caused greater contention: instead of providing transaction IDs and associated memory to approximately 24 InnoDB threads, kernel mutex was now working like mad to provide IDs and memory to approximately 48 InnoDB threads. Imagine having a single toll booth on a 16 lane highway and then doubling the number of lanes.
In the discussions that followed, some called for rolling back to the smaller machines, reasoning that fewer threads would mean less CPU contention. Others believed that rolling backward would be a mistake, arguing that our business growth required the more powerful servers in any case, and that doubling the number of CPUs was not itself a problem, but rather part of the ultimate solution because it exposed the root cause of the extreme system CPU usage.
The right course – the one we ultimately took – was to stick with the more powerful servers and tune them properly.
Adopting TCMalloc
We quickly found several resources online, including a key blog post about TCMalloc (Thread-Caching Memory Allocation) and an article about debugging MySQL.
Traditional memory allocation schemes, like the glibc malloc that we were then using, employ a mutex to prevent concurrent access to the transaction ID counter. Preventing concurrency is totally wrong for a multi-core, multi-thread architecture like ours.
In contrast, TCMalloc allocates a small pool of memory to each CPU core. Individual processor threads obtain RAM directly from their core, ideally from the L2 cache nearest the thread’s section of the CPU. This sounded promising, so we switched to TCMalloc.
Following the switch, things looked pretty good. User CPU decreased dramatically, never to return to the +50% usage we’d seen before. We had finally solved the memory allocation bottleneck. If we hadn’t doubled the number of CPUs, we wouldn’t have found the problem that lead us to adopt TCMalloc.
Had we finally solved our scalability problem?
Transparent Huge Pages: Thanks for your help…please don’t help
By the next morning CPU contention was worse.
The alarmingly high system CPU usage that we’d seen in the previous 3 months was always due to MySQL using kernel mutex. But since we’d fixed that problem, what the heck was this?
We discussed turning off TCMalloc, but that would’ve been a mistake. Implementing TCMalloc was a critical link in the chain of problems and solutions that ultimately strengthened our platform.
We discovered very quickly that the culprit this time was a khugepaged enabled by a Linux kernel flag called Transparent Huge Pages (THP; turned on by default in most Linux distributions). Huge pages are designed to improve performance by helping the operating system manage large amounts of memory. They effectively increase the page size from the standard 4kb to 2MB or 1Gb (depending on how it is configured).
THP makes huge pages easier to use by, among other things, arranging your memory into larger chunks. It works great for app servers that are not performing memory-intensive operations.
Which is why THP is so wrong for our platform. By late 2014 we were using 95% of the RAM and 58% of the 32 CPU cores in our servers . In order to store all of those tiny transaction IDs, we were rewriting memory so rapidly that THP’s efforts to move pages around couldn’t keep up. Clearly, standard 4kb blocks were much more efficient for us than the larger page size that THP was “helping” us with. So we turned THP off. The following image tells the story.
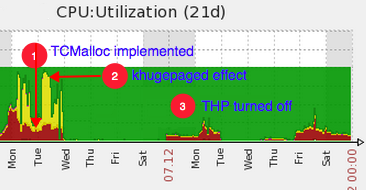
Note: Flat areas in the graph showing no CPU usage indicate periods when we were running on a secondary server.
In a sense, encountering the dramatic effect of THP, an operating system problem, was clarifying. It validated our previous remedies, and turning it off definitely strengthened our platform.
Lessons learned
Beyond the technical lessons we learned during this period, we were reminded that sometimes the best thing to do is stay the course. At times we were tempted to pull back, but moving forward ultimately paid off as each improvement we made exposed the inadequacy (for our platform) of a downstream component.
Okta Developer Blog Comment Policy
We welcome relevant and respectful comments. Off-topic comments may be removed.