On this page
Monitor and troubleshoot rate limits
Use the following sections to monitor and troubleshoot rate limits.
Alerts and notifications
Okta’s alerting and notification features help you detect, investigate, and respond to critical system and API events. Alerts appear in your Admin Console, rate limit dashboard, System Log, and email—and often, Okta also includes helpful context in HTTP response headers.
Note: Alerts (email and rate limit dashboard) are triggered by overall usage against an org-scoped bucket, not by individual API token or app capacity. Email notifications are sent only on initially reaching the defined warning, burst, or violation limit and not for every endpoint call that exceeds these limits.
| Alert type | What it means | Triggers | Frequency of Email alerts | Visibility |
|---|---|---|---|---|
| Warning | API usage approaching the default rate limit. | Custom threshold % defined in the rate limit dashboard settings. | Once per day per bucket | Admin Console dashboard, rate limit dashboard, System Log, Email |
| Burst | Short-lived increase in the rate limit threshold for supported endpoints. | The default rate limit for a bucket is exceeded (authentication and authorization endpoints only). | Once per day per bucket | Admin Console dashboard, rate limit dashboard, System Log, Email |
| Violation | The default rate limit exceeded and requests were denied with 429 response code. | The default rate limit for a bucket is exceeded. | Once per hour per bucket | Admin Console dashboard, rate limit dashboard, System Log, Email |
Rate limit dashboard
The rate limit dashboard helps you monitor, troubleshoot, and optimize API traffic across your Okta org. It’s built to give real-time insight into rate limit usage so you can prevent disruptions and resolve incidents quickly.
What you can do here:
Track usage and trends for each org-scoped bucket
Investigate rate limit warnings, bursts, and violations
Configure custom warning thresholds
Enable per-client rate limiting
Identify traffic patterns by IP, API token, or OAuth2 apps
Common use cases
| Use case | What to do |
|---|---|
| Preparing for a high-traffic event | Check current traffic patterns, plan for expected loads, and/or adjust limits or thresholds |
| Just received a violation alert | Jump into the dashboard to inspect which endpoint, IP, or client caused it |
| Monitoring proactively | Use event graphs and tables to catch rising trends and respond before violations happen |
| Tuning warning notifications | Adjust thresholds to avoid alert fatigue or late detection |
Who has access:
The rate limit dashboard can be accessed through the Admin Console: Reports > Rate Limits. Only the following administrator roles can access this dashboard:
- App Admin (
APP_ADMIN) - Mobile Admin (
MOBILE_ADMIN) - Org Admin (
ORG_ADMIN) - Read-only Admin (
READ_ONLY_ADMIN) - Super Admin (
SUPER_ADMIN) - API Access Management Admin (
API_ACCESS_MANAGEMENT_ADMIN) - Report Admin (
REPORT_ADMIN)
See also: Standard administrator roles and permissions (opens new window) and Roles in Okta (opens new window).
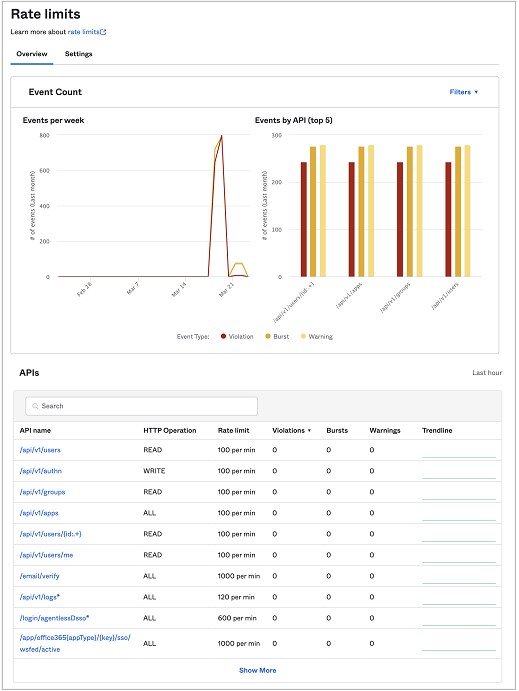
Dashboard overview tab
The Overview tab is your monitoring hub. Use it to scan for issues or drill into specifics.
- Event graphs: Visualize warnings, bursts, and violations over time.
- Top offenders: A bar graph shows the top five APIs with the most rate limit events.
- Rate Limit Buckets table: Each bucket is listed with current rate limits (including overrides and multipliers), recent events, and a usage trend line for the last hour.
You can hover to reveal detailed data points, click on a rate limit bucket to see deeper metrics and historical usage, or filter by time period, multiplier status, or event type.
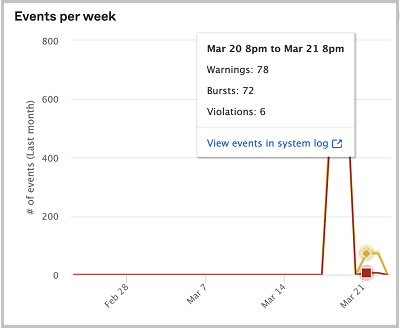
Events graph
The event count graph plots the number of violations, bursts, and warnings over the selected time period, which can be the last 24 hours, the last seven days, last month, or the last three months. The events by API bar graph shows the top five number of events by API over the same time period.
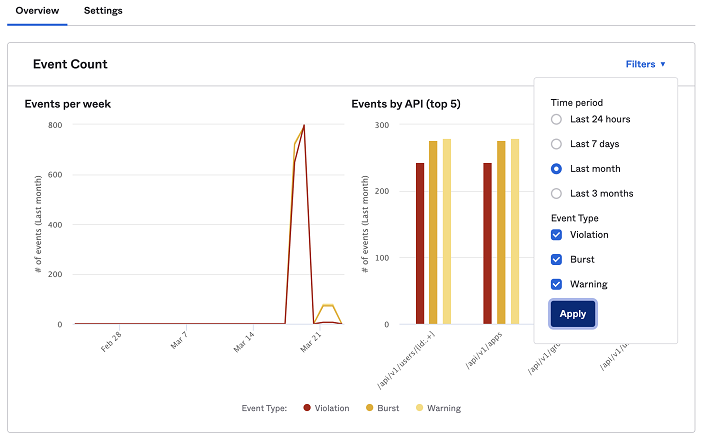
You can hover over the line graph or bar graph to get more details. The details also include a link to the System Log where you can view filtered events specific to that rate limit bucket and time period.
Rate Limit Buckets table
This sortable, filterable table shows the following for each rate limit bucket:
- Effective rate limit (including multipliers and overrides)
- Violations, bursts, and warnings for the last hour
- A mini trend line for current traffic and a direct link to detailed API usage
You can also use the search box to look up specific endpoints. For example, you're calling Okta with an example requestURI and you want to know the rate limit that's applied to calls that are made against that requestURI.
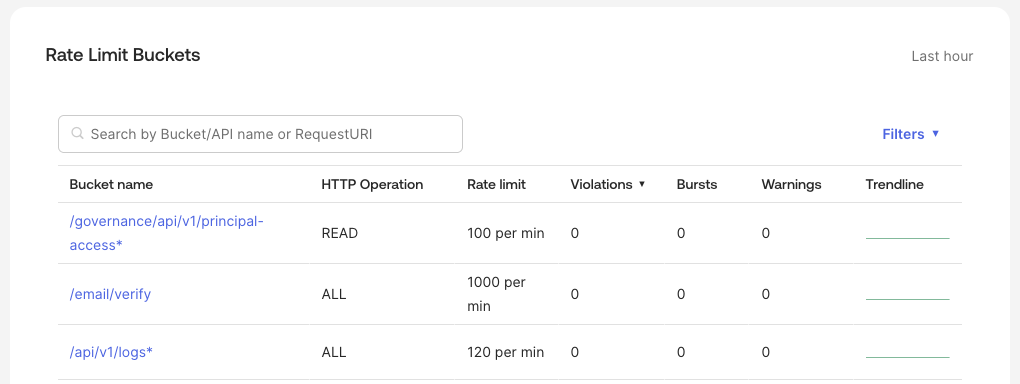
Unless a bucket is specifically listed in the dashboard, buckets that end with an asterisk (for example, /api/v1/users*) denote a bucket set up for the longest match, that is, where no exact match configuration exists. For more information, see Match Requests. It's also important to note the HTTP operation involved with each request, as the same request with different operations can count towards different limits.
Dashboard settings tab
Customize your org’s client rate limit behavior and warning thresholds in this tab.
Client-based rate limiting
Client-based rate limiting provides granular, targeted protection for the unauthenticated endpoints used during an app's access flow. By default, per-client rate limiting is enabled. Each client is allocated 60 requests per minute. See Client-based rate limits for more details.
Warning thresholds
Set the percentage of your limit at which you want to be notified. You can fine-tune these thresholds to match the nature of your traffic so that alerts are timely and relevant.
For example, you may want to customize the rate limit threshold when an API normally has high traffic. In such a case, if the threshold is set too low, such as at 60%, this may generate too many warning notifications.
Investigate API usage
Clicking a bucket in the Rate Limit Buckets table takes you to a deep-dive dashboard. Any alerts provided by Okta also provide a link to the deep-dive dashboard for the impacted endpoint.
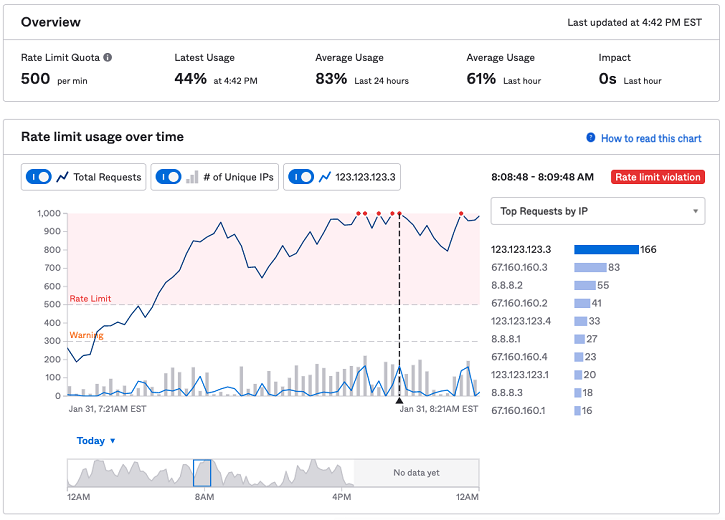
Overview Pane:
Rate limit: The rate limit for this bucket per minute for your org. If the traffic hits the rate limit for your org, the system triggers a rate limit violation. Hovering over the information icon displays multipliers applied or purchased.
Latest usage: This is the current percentage of the rate limit consumed for this bucket (this includes all endpoints for a given bucket).
Average usage: This is the percentage of the rate limit consumed for this API within the last 24 hours and the last hour.
Impact: The amount of time that the org is affected by a rate limit violation on this API. The impact time is the remainder of the one-minute interval after your org hits the rate limit. For example, if your org hits the rate limit 40 seconds into the one-minute interval, then the impact time is 20 seconds for that API.
Rate Limit Usage over Time Pane:
Line graph: Shows the total number of requests within a one-minute window and the number of unique IPs over the past hour for the bucket if the Total Requests and # of Unique IPs toggle buttons are enabled. If an IP address is selected in the bar graph, the line graph also shows the traffic from that IP address. Hovering over the line graph shows you the number of requests and the number of unique IPs in the past hour.
Timeline graph: Allows you to compare traffic for the same endpoint across multiple days to spot recurring spikes. Defaults to Today but can go back 7 days.
Bar graph: Shows the top 10 IP addresses, API tokens, or OAuth 2.0 apps that consume the most traffic for that API.
Troubleshoot your rate limits
Okta provides several tools to give you real-time visibility into your rate limit usage so that you can prevent disruptions and resolve incidents quickly. The troubleshooting process can be simplified into four steps:
- Confirm
- Identify
- Correlate
- Action
Confirm you’re hitting a rate limit
- Check for HTTP 429 responses in your app logs or API client
- Alerts in the rate limit dashboard or notifications in your email inbox
- Check the System Log for rate limit violation events
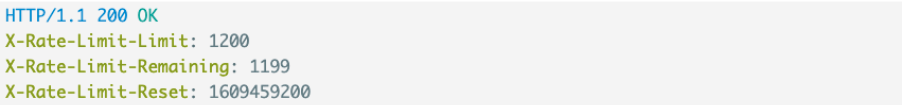
- Inspect the response headers Okta provides for information about org-wide rate limits and concurrency limit violations.
X-Rate-Limit-Limit: the rate limit ceiling that’s applicable for the current request.X-Rate-Limit-Remaining: the number of requests left for the current rate-limit window.X-Rate-Limit-Reset: the time at which the rate limit resets, specified in UTC epoch time (in seconds).
Example rate limit header with org-scoped rate limit
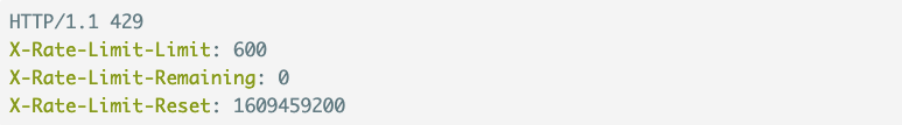
Example rate limit header with org-scoped rate limit exceeded
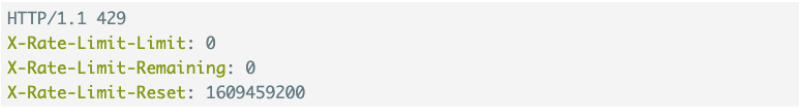
Example rate limit header with concurrent rate limit exceeded
Identify the source
Check the rate limit dashboard for more information:
- Go to your Admin Console. Click Reports > Rate Limits
- On the Overview tab and the deep-dive dashboard for rate limit buckets (APIs), identify:
- Which buckets are exceeding limits
- Any spikes in warnings, bursts, or violations
- The top contributors (IP, app, or token)
See Rate limit dashboard.
Investigate the System Log to correlate events with users, jobs, or integrations
Search the System Log for the following events or use the System Log API (opens new window):
eventType eq "system.rate.limit.violation"eventType eq "core.concurrency.org.limit.violation"eventType eq "system.rate.limit.burst"(for burst events)eventType eq "system.rate.limit.warning"
Each event includes the endpoint (requestURI), the actor, thresholds, and actual counts, along with the direct link to the rate limit dashboard.
Action
After you have confirmed 429 errors and understand the root cause, you can employ a few strategies.
| Root cause | Description | Strategies to fix |
|---|---|---|
| Intended high usage | A planned business event, such as an e-commerce product launch or a workforce app rollout, generates a legitimate, high-volume surge of user traffic that exceeds default limits | • Implement throttle logic and retries with backoff. The Okta SDK has a configuration library available for this use case. • Purchase DynamicScale to permanently increase rate limits. • Request a rate limit increase. |
| Authentication spikes | Many customers or employees attempt to log in simultaneously in response to a time-based event, such as a flash sale starting at noon or a company-wide all-hands meeting. | • Purchase DynamicScale to permanently increase rate limits. • Request a rate limit increase. |
| Runaway automation | An inefficient or misconfigured script —such as a customer data sync process, an IT management tool, or a testing suite —makes excessive and repetitive API calls in a tight loop without proper error handling or delays. | • Implement throttle logic, 429 error handling, and retries with backoff. • Adjust the token or app rate limit. • Avoid aggressive, unnecessary polling to Okta. Use event hooks if available and suitable for your use case. • Retrieve only the necessary data to avoid repeatable calls. • Consider peak usage and batch jobs across time, if possible. |
| Individual client flooding an endpoint | A single client app, such as a public-facing mobile app or an internal web portal, floods a specific unauthenticated endpoint like /authorize due to a bug or batch test, triggering client-based limits designed to isolate the misbehaving actor. | • Enable per-client limits and logging. • Request a per-client rate limit adjustment (default 60). |
| Importing data to Okta | A migration from a workforce HR system sync attempts to create or update thousands of users at once without proper throttling, quickly consuming management API rate limits. | • Request a rate limit increase before the rollout. • Use Just-In-Time (JIT) provisioning. • Increase AD agent thread count to 10. • Avoid last-minute imports and load your data ahead of the go-live. |